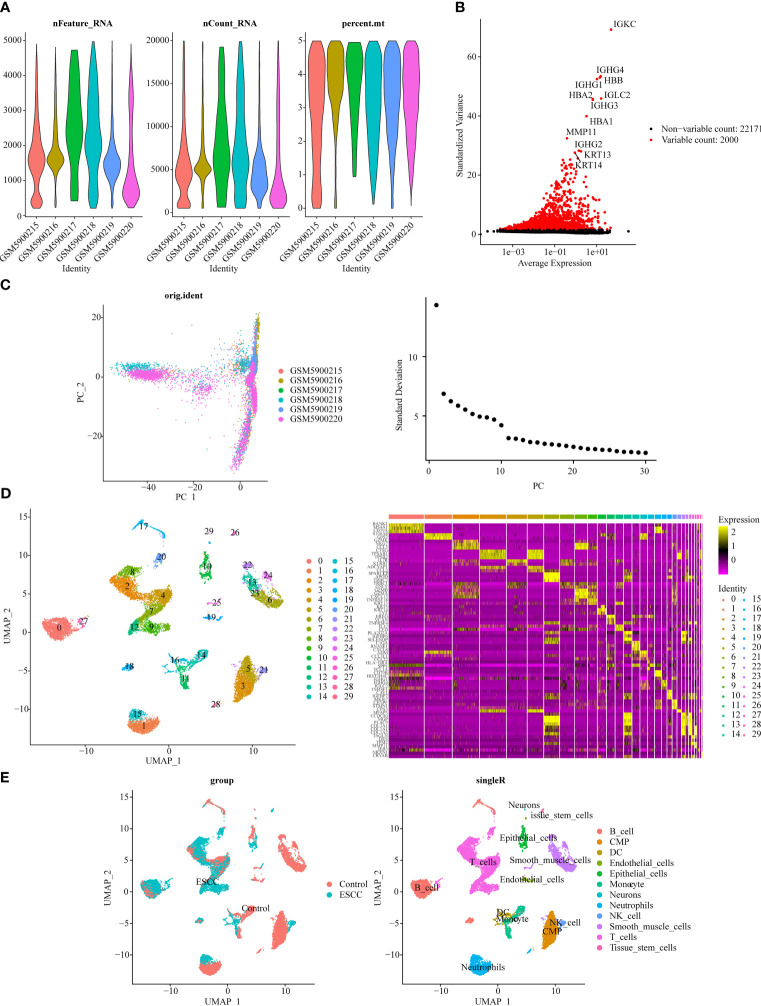
Figure 2.
Single-cell transcriptome data analysis for GSE196756. (A) Violin plot of nFeature, nCount, and percent.mt after quality control. (B) Volcano plot depicted 2,000 highly variable genes (red). (C) Principal component analysis (PCA) determined the optimal dimensions. (D) UMAP clustering plot displayed 30 cell clusters in the sample, and heat map depicted the marker genes in 30 cell clusters. (E) UMAP clustering plot revealed 12 different cell subtypes.

