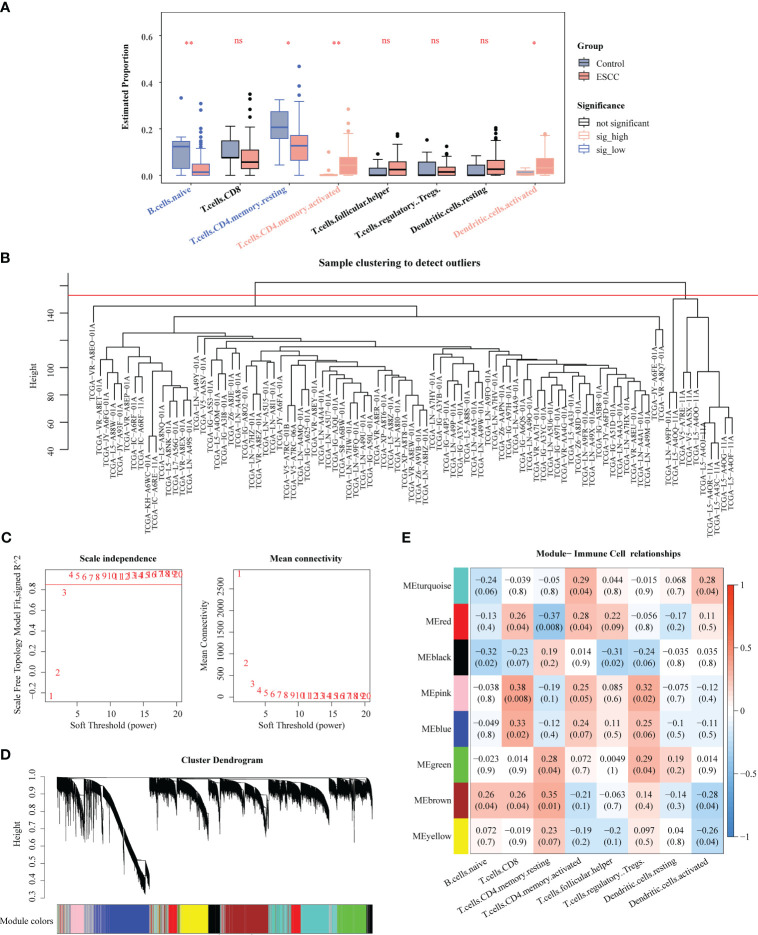
Figure 3.
Identification of key genes associated with immune cells by WGCNA. (A) Comparison of immune cells between ESCC and control samples. (B) Clustering of TCGA-ESCC dataset samples. (C) Determination of the optimal soft threshold. (D) All genes were classified into various modules by hierarchical clustering. (E) Heatmap of module-trait correlation. * P < 0.05, ** P < 0.01; ns, no significance.

