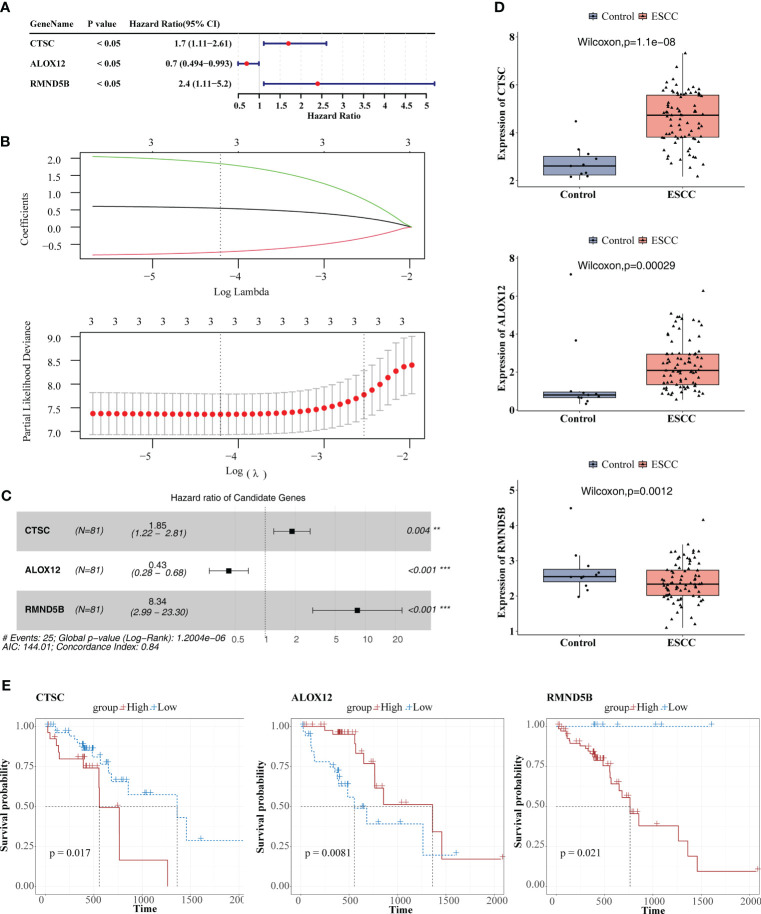
Figure 5.
Identification of prognosis-related genes. (A) Univariate cox analysis. (B) Least absolute shrinkage and selection operator (LASSO) regression analysis. (C) Multivariate Cox analysis. (D) Comparison of the expression of the three prognosis-related genes between ESCC and control samples. (E) KM survival curves between high and low expression groups of three prognosis-related genes. ** P < 0.01, *** P < 0.001.

