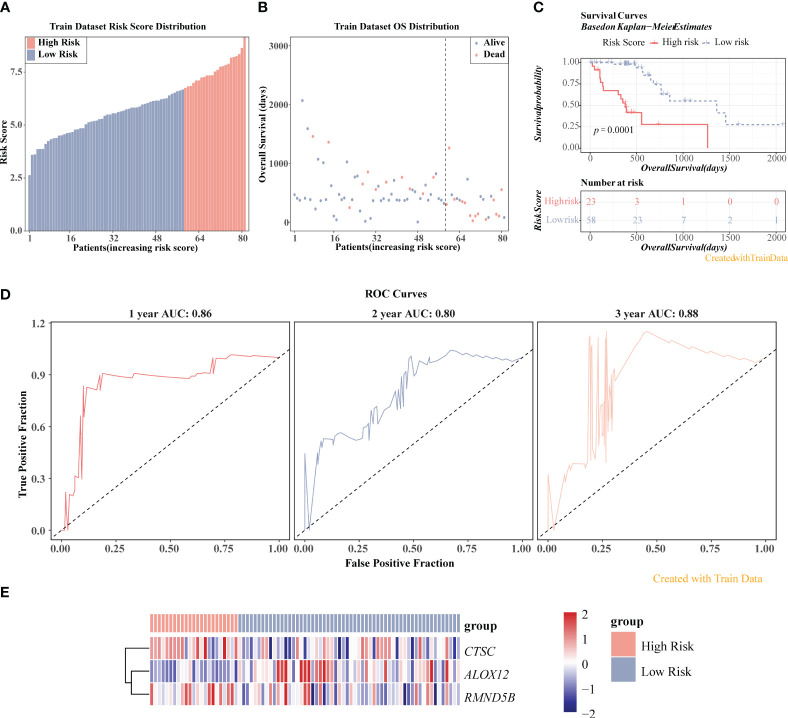
Figure 6.
Prognostic value of three prognosis-related genes in TCGA-ESCC dataset. (A) Risk score distribution of ESCC samples. (B) Overall survival (OS) distribution of ESCC samples. (C) K-M survival analysis of ESCC samples. (D) ROC curves for 1-, 2-, and 3-year survival in ESCC patients. (E) Heatmap displayed the expression levels of three genes in high-/low-risk groups.

