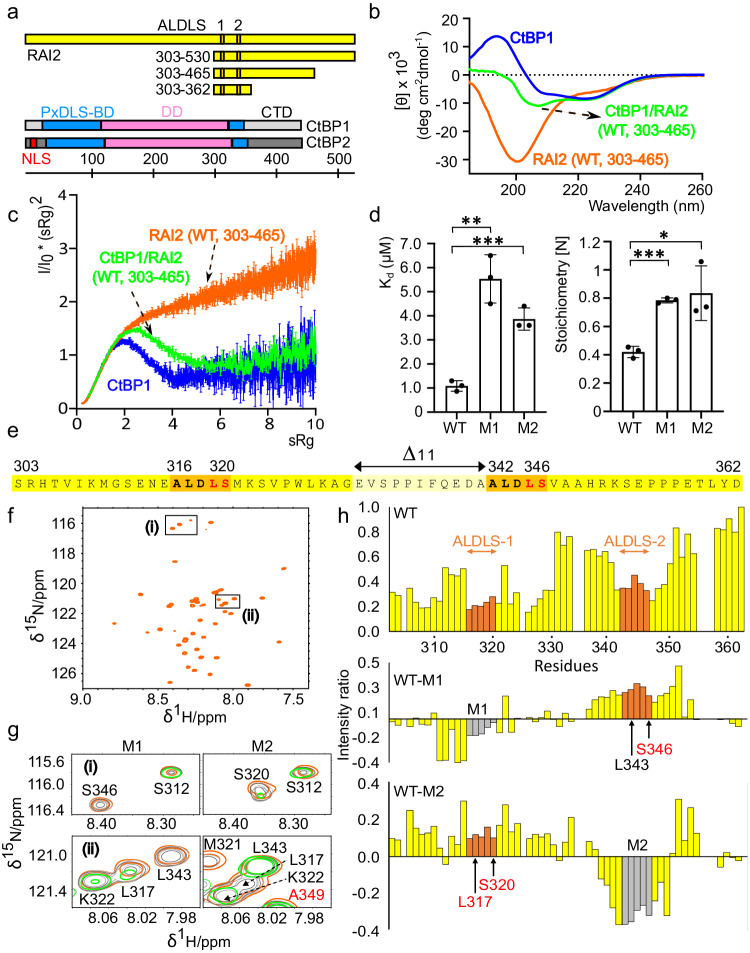
Fig. 1. Tandem ALDLS motif-containing RAI2 binding to CtBP is autonomous.
a Protein constructs in proportion to their length. Colors: RAI2, yellow: ALDLS motifs 1 and 2, orange; CtBP1 and CtBP2: split PxDLS binding domain (BD), blue; dehydrogenase domain (DD), pink; C-terminal domain (CTD), gray; nuclear localization sequence (NLS), red. CTD gray shades of CtBP1 and CtBP2 indicate CTD diversity. b CD spectra of CtBP1(WT, FL) (blue), RAI2(WT, 303-465) (orange) and CtBP1(WT, FL)/RAI2(WT, 303-465) complex (green). c SAXS Kratky plots of the protein constructs used in (b) indicating the level of structural flexibility and fold content. The plots are based on a single experiment each and the error bars represent the propagated SEM of the scattering intensities measured at each point following Poisson counting statistics90. The data have been taken from SASBDB entries SASDQW5, SASDQ46, and SASDQC6. d Dissociation constants KD (left panel) and stoichiometry values (right panel) of RAI2(303–362) WT, M1 and M2 to CtBP1. The data are represented as mean of n = 3 independent biological replicates ± SD. Unpaired t-test was used to evaluate statistical significance applying p values for a two-sided confidence interval as follows: p < 0.001 (***), p < 0.01 (**), p < 0.05 (*). Definition p values: KD: p = 0.0017 M1, p = 0.0007; Stoichiometry: p = 0.0001 M1, p = 0.0217 M2. e Sequence of RAI2(WT, 303–362, yellow) comprising the twofold repeated ALDLS motif (orange). Residues mutated in RAI2 M1, M2 and M1 + M2 variants are in red. Removed linker residues in RAI2(Δ11, 303–362) are in light yellow and are indicated by a double arrow. f HSQC spectra of RAI2(WT, 303–362). g Effects of CtBP1 titration on selected RAI2 residues (boxed and labeled in F) in M1 (left) and M2 (right) variants. Colors of increasing amounts of titrated CtBP1 (WT, 28–353) on RAI2(303–362) variants: orange (1:0), dark gray (1:0.4), light gray (1:0.7), and green (1:1). h Histogram of chemical shift perturbation intensity ratios upon titration of CtBP1(28–353) onto RAI2(303–362) variants (WT, M1, M2). Mutated ALDLS sites are in gray. Low intensity ratios indicate perturbation of RAI2 residues in the presence of CtBP. See also Supplementary Figs. 1–5, Supplementary Table 1 and Supplementary Data 1, 3–5, and 8. Source data are provided as a Source Data file.

