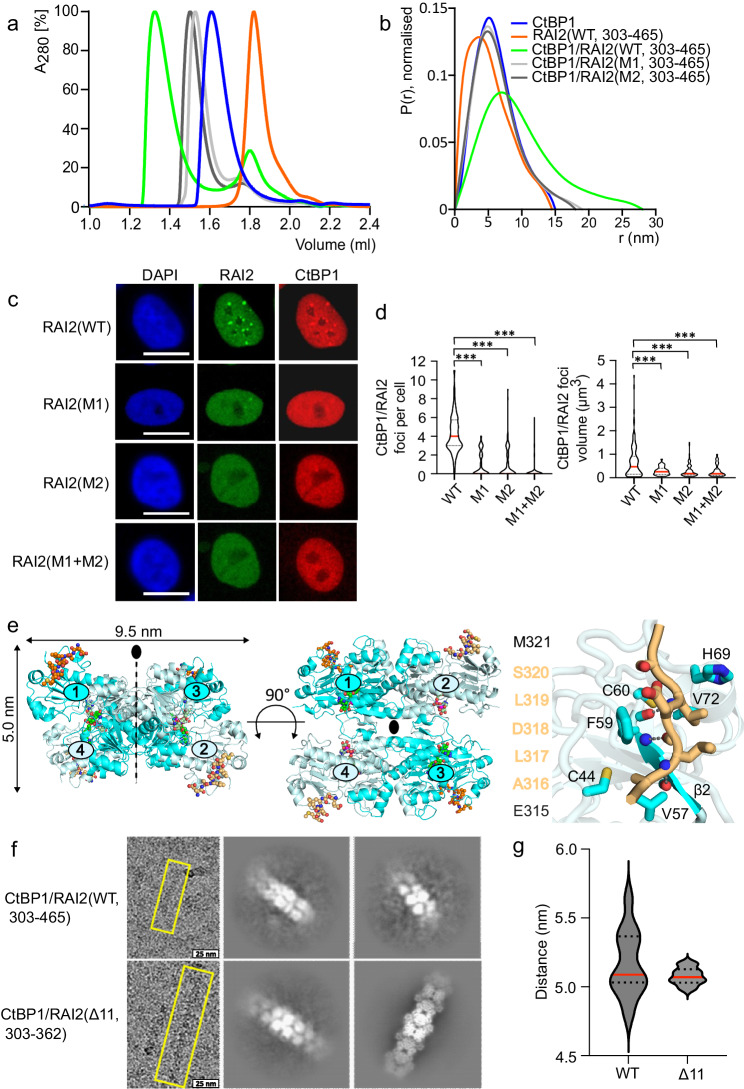
Fig. 2. Tandem ALDLS motif-containing RAI2 induces CtBP polymerization.
a Normalized SEC profiles of CtBP1(WT, blue), RAI2(WT, 303–465, orange) and complexes of CtBP1(WT) with RAI2(WT, green), RAI2(M1, light gray), RAI2(M2, dark gray). b SAXS distance distribution P(r) profiles of CtBP1 in complex with RAI2(303–465) variants. The plots are based on a single experiment and the data have been taken from SASBDB entries SASDQW5, SASDQ46, SASDQC6, SASDQD6, and SASDQE6. c Immunofluorescence staining of CtBP1 (red) and RAI2 variants (green) in KPL-1 cell nuclei. Nuclei are stained with DAPI (blue). Scale bars: 10 µm. d Violin plot depicting the number of CtBP1/RAI2 foci per cell (left) and foci volumes (right) of one representative experiment. Medians and quartiles have been shown as red and dashed black lines, respectively. The foci per cell were plotted based on 100 cells for each RAI2 construct used. Foci volumes were plotted based on n = 153 (WT), n = 38 (M1), n = 85 (M2), n = 39 (M1 + M2) foci analyzed. Unpaired t-test was used to evaluate statistical significance by applying p values for a two-sided confidence interval as follows: p < 0.001 (***), p < 0.01 (**), p < 0.05 (*). Definition p values: foci per cell and foci volumes = p < 0.001. RAI2(WT) was used as a reference. e Crystal structure of the tetrameric [(CtBP2(WT, 31–364)/NAD+)2]2/RAI2(M2, 303–465)4 complex in side view (left) and top view (middle). CtBP2 molecules are in cartoon presentation, colored cyan, and pale cyan, and numbered. The visible segments of RAI2 (315–321, orange) and NAD+/NADH ligands (green) are in ball-and-stick representation. Oxygen, nitrogen, and phosphorus atoms are in red, blue, and magenta, respectively. Right panel, zoom of the CtBP/RAI2-binding site, highlighting specific CtBP-RAI2 interactions within 4 Å distance. The visible RAI2 sequence around the interacting ALDLS motif is shown on the left. Hydrogen bonds are indicated by dashed lines. The CtBP strand β2 is highlighted and labeled (cf. Supplementary Fig. 13). f Cryo-EM micrographs (left panel) and 2D classes of CtBP1(WT, FL)/RAI2(WT, 303–465) and CtBP1(WT, FL)/RAI2(Δ11, 303–362) complexes. Yellow boxes (left) show a representative fiber for each complex. g Violin plot depicting CtBP1 tetramer layer distances (nm), showing reduced distance variability for RAI2(Δ11) compared to RAI2(WT) used for filament formation with CtBP1. The distances were obtained from n = 12 cryo 2D classes for each RAI2 construct used. Medians and quartiles are shown in red and black dashed lines, respectively. See also Supplementary Figs. 3, 4, and 6–9, and Supplementary Tables 2–4 and Supplementary Data 1 and 5. Source data are provided as a Source Data file.

