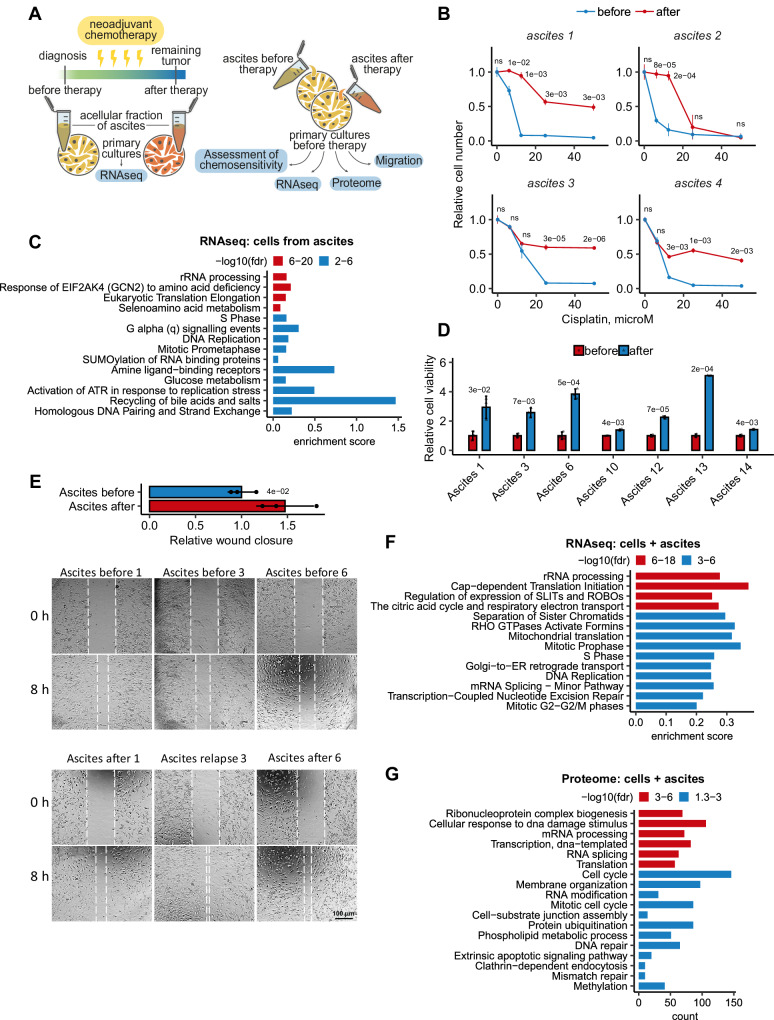
Fig. 1. Ovarian cancer ascites after chemotherapy contributes to de novo therapy resistance.
A Scheme showing the collection and processing of paired ascitic fluids isolated from patients before and after chemotherapy (left panel). Experimental workflow used to assess the effect of paired ascitic fluids before and after chemotherapy on phenotype and behavior of primary cultures of ovarian cancer cells (right panel). B In vitro viability assay of ovarian cancer cells isolated from paired ascites before (blue curves) and after (red curves) chemotherapy and subsequently treated with different concentrations of cisplatin. Dose-response curves of ovarian cancer cells were determined by an MTT assay on day 2 after cisplatin adding. The data represent the mean values ± SD (standard deviation) (n = 3 biologically independent experiments). С GSEA analysis of gene expression in ovarian cancer cells isolated from ascites after chemotherapy versus cells isolated from ascites before therapy. The X-axis represents GSEA enrichment score. D Primary cultures of ovarian cancer cells were pre-incubated for 3 days with autologous ascites before (blue bars) and after (red bars) chemotherapy, and then cancer cells were treated with cisplatin (10 µM). In vitro cell viability was assessed on day 2 after cisplatin adding using MTT assay. The data represent the mean values ± SD (n = 3 biologically independent experiments). E Wound healing assay of primary cultures of ovarian cancer cells that were pre-incubated for 3 days with autologous ascites before and after chemotherapy. The width of the wound area was measured immediately after scratching (0 h) and the relative closure was measured after 8 h for three primary cultures of ovarian cancer cells. The bar graph illustrates wound closure, expressed as the fold change, denoting the ratio of mean values of wound widths between two states: cell cultures pre-treated with ascites after chemotherapy relative to cells pre-treated with ascites before chemotherapy. The data represent the mean values ± SD (n = 3 biologically independent experiments). F GSEA analysis of gene expression in ovarian cancer cells pre-incubated for 3 days with autologous ascites after chemotherapy versus ascites before therapy. The X-axis represents GSEA enrichment score (p-values are indicated by colors). G Gene Ontology enrichment analysis of proteins whose abundance increased at least 2 times in ovarian cancer cell cultures incubated for 3 days with autologous ascites after chemotherapy versus ascites before therapy. The X-axis represents the number of proteins associated with each pathway (p-values are indicated by colors). The p-value was obtained by two-tailed unpaired Student’s t test (B, D, E). ClusterProfiler was used for functional enrichment analysis with all genes as background (G). Gene expression signature analysis was performed using the “signatureSearch” packages in “R” against the Reactome database (C, F). A hypergeometric test was carried out and all significant categories (false discovery rate < 0.05, after correction for multiple testing using the Benjamini–Hochberg procedure) are displayed. Source data are provided as a Source Data file.

