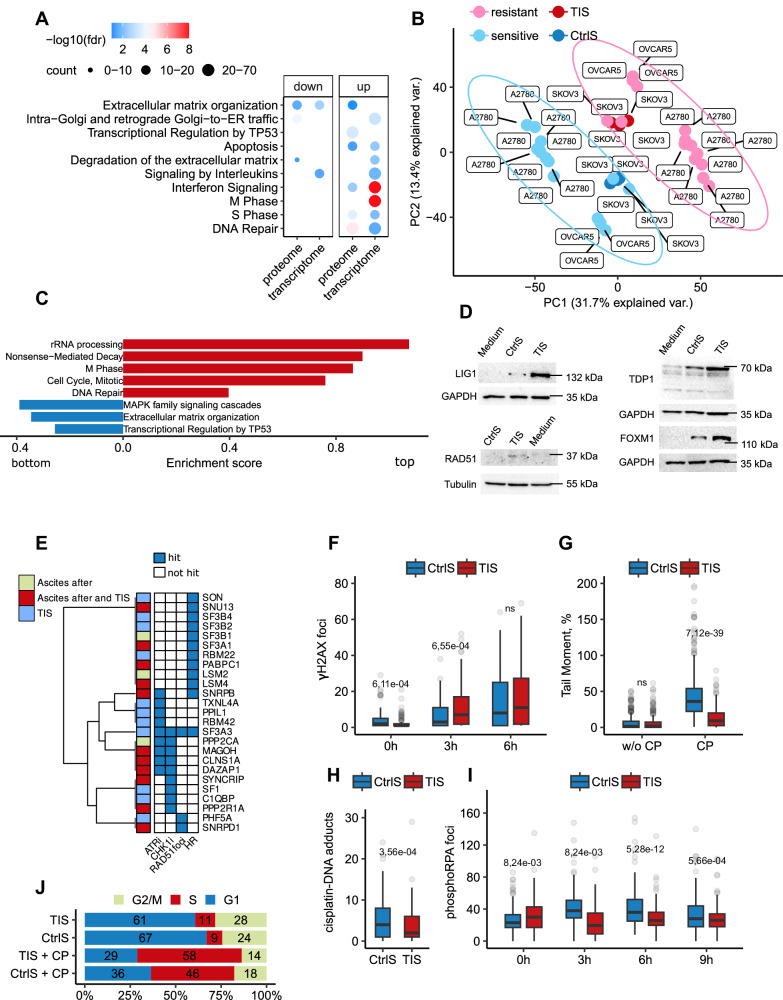
Fig. 5. Therapy-induced secretomes of ovarian cancer cells activate pathways important for cell response to DNA damage.
A Gene Ontology enrichment analyses of upregulated genes and proteins in SKOV3 cells incubated for 3 days with therapy-induced secretomes (TIS) compared to control secretomes (CtrlS). The color scale refers to −log10 (FDR) values; the number of proteins/genes are represented by the diameter of the circles. B The principal component analysis of RNAseq data obtained from platinum-sensitive and -resistant isogenic ovarian cancer cell lines and recipient SKOV3 cells incubated for 3 days with TIS or CtrlS. Pink—platinum-resistant ovarian cancer cell lines, light blue—platinum-sensitive ovarian cancer cell lines, red—recipient SKOV3 cells incubated with TIS, dark blue—recipient SKOV3 cells incubated with CtrlS. C GSEA analysis of gene expression in platinum-resistant ovarian cancer cell lines versus platinum-sensitive ovarian cancer cell lines. The X-axis represents GSEA enrichment score (p-values are indicated by colors). D Western blotting analysis of SKOV3 cells that were incubated for 3 days with TIS or CtrlS from donor SKOV3. E Results of the intersection between spliceosomal proteins identified in TIS from SKOV3 cells and/or in ovarian cancer ascites after therapy (our data) and the hits from siRNA and CRISPR screenings (derived from data reported in refs. 42–44). ATRi and CHK1i—CRISPR screens with inhibitors targeting ATR and CHK1, respectively. Loss of spliceosomal proteins indicated as “hit” increased the sensitivity of cancer cells to ATR or CHK1 inhibition [42]. RAD51 foci and HR—siRNA screenings indicating that knockdown of spliceosomal protein impair the formation of IR-induced RAD51 foci or decreased homologous recombination (HR) potential in the DR-GFP assay in cancer cells, respectively, 43,44. F Box plots show the number of γH2AX foci per nucleus in SKOV3 cells pre-incubated with TIS or CrlS for 3 days and then treated with cisplatin (25 µM) at different time points (TIS: 0 h n = 134 cells, 3 h n = 136 cells, 6 h n = 129 cells; CtrlS: 0 h n = 109 cells; 3 h n = 130 cells; 6 h n = 144). The number of γH2AX foci was calculated using ImageJ software with FindFoci plugins. G Box plots of tail moments from neutral comet assays of SKOV3 cells pre-incubated with TIS or CrlS for 3 days and then treated with cisplatin (10 µM) for 48 h (TIS: CP n = 381 cell, w/o CP n = 368 cells; CtrlS: CP n = 469 cells, w/o CP n = 296). Experiments were performed in triplicate. H Box plots show the number of cisplatin-DNA adducts’ foci per nucleus of SKOV3 cells pre-incubated with TIS or CrlS for 3 days and then treated with cisplatin (25 µM) for 48 h (TIS n = 243 cells; CtrlS n = 146 cells). The number of cisplatin-DNA adducts’ foci was calculated using ImageJ software. I Box plots show the number of phosphorylated RPA2 (phospho S33) foci per nucleus in SKOV3 cells pre-incubated with TIS or CrlS for 3 days and then treated with cisplatin (25 µM) at different time points (TIS: 0 h n = 194 cells, 3 h n = 216 cells, 6 h n = 264 cells, 9 h n = 241; CtrlS: 0 h n = 228 cells; 3 h n = 195 cells, 6 h n = 174, 9 h n = 193). The number of phosphorylated RPA2 foci was calculated using ImageJ software. J Cell cycle analysis with flow cytometry of SKOV3 cells pre-incubated with TIS or CrlS for 3 days and then treated with cisplatin (10 µM) for 24 h. Stacked bar graphs show the percentage of cells in different phases of the cell cycle. Percentage of cells in G1, S, and G2 phases was calculated with NovoExpress software. Secretomes were collected as indicated in Fig. 3B. The line in each box is the median, the up and low of each box are the first and third quartiles. The upper whisker extends from the up of the box to the largest value no further than 1.5*IQR (where IQR is the inter-quartile range). The lower whisker extends from the low of the box to the smallest value at most 1.5*IQR. Data beyond the end of the whiskers are called “outlying” points and are plotted individually. The p-value was obtained by two-tailed unpaired Student’s t test (F–I). Gene expression signature analysis was performed using the “signatureSearch” packages in “R” against the Reactome database (C). Source data are provided as a Source Data file.

