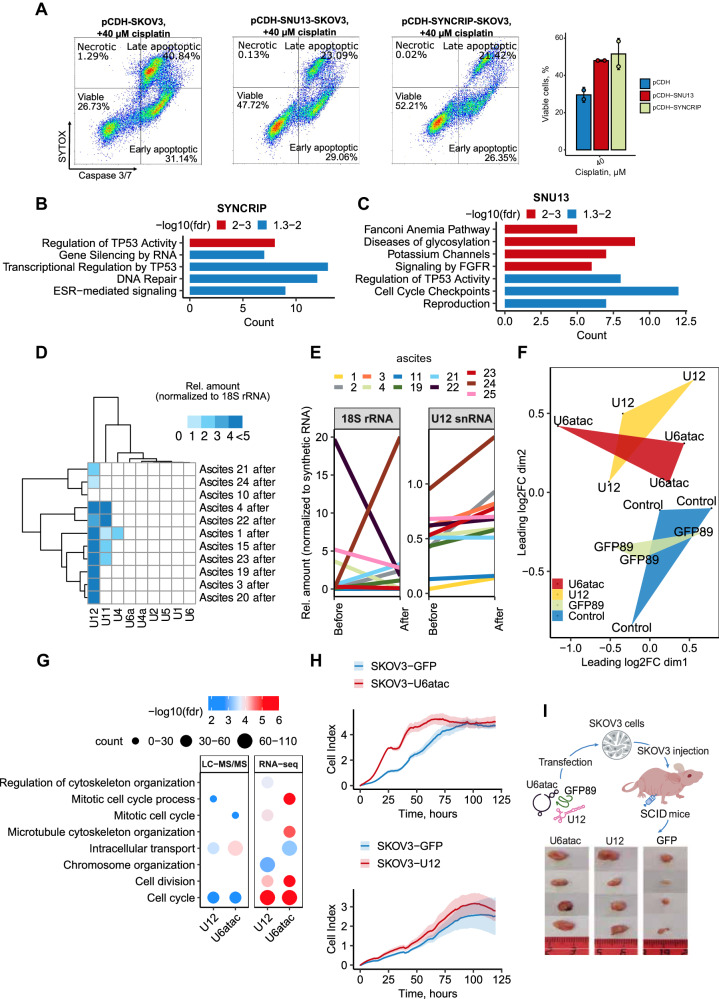
Fig. 6. Extracellular spliceosomal components contribute to the aggressiveness of ovarian cancer.
A Flow cytometry analysis of caspase 3/7 activity and SYTOX staining of SKOV3 cells stably expressing SYNCRIP, SNU13 or an empty vector (pCDH), treated with 40 μM of cisplatin for 24 h. The bar graph (on the right) shows the percentage of viable cells for each cell line 24 h after treatment with 40 µM of cisplatin (n = 2 biologically independent experiments). B Reactome enrichment analysis of upregulated genes in SKOV3 cells overexpressing SYNCRIP versus control pCDH cells 24 h after cisplatin (40 µM) addition (p-values are indicated by colors). C Reactome enrichment analysis of upregulated genes in SKOV3 cells overexpressing SNU13 versus control pCDH cells 24 h after cisplatin (40 µM) addition (p-values are indicated by colors). D Heat map displaying the relative amount of 9 snRNAs in ovarian cancer cells and malignant ascitic fluids after chemotherapy from 11 patients. The data represent the mean values ± SD (n = 3 biologically independent samples). E Spaghetti plots of U12 snRNA and 18S rRNA levels in paired ascitic fluids from 11 patients before and after chemotherapy. The data represent the mean values ± SD (n = 3 biologically independent samples). F Multidimensional scaling (MDS) plot of all expressed genes reflects changes between control cells transfected with empty lipofectamine (blue) or GFP mRNA fragment (green) and cells transfected with U12 snRNA (yellow) or U6atac snRNA (red). Each point represents 1 sample, and the distance between 2 points reflects the logFC of the corresponding RNA-seq samples. G Gene Ontology enrichment analysis of upregulated proteins (left panel) or genes (right panel) in SKOV3 cells transfected with synthetic U12 snRNA or U6atac snRNA compared to control cells transfected with empty lipofectamine. The color scale refers to −log10 (FDR) values; the number of proteins/genes are represented by the diameter of the circles. H xCELLigence proliferation assay of SKOV3 cells overexpressing U12 snRNA (top panel), U6atac snRNA (bottom panel) or control GFP mRNA fragments (with the corresponding promoters: U2 or U6, respectively). SKOV3 cells were seeded in 96-well E-plates for xCELLigence assay monitoring impedance (cell index, CI) (n = 3 biologically independent samples). Mean values of the CI were plotted ± standard deviation. I Scheme of the experiment (top panel) and the representative tumor images (bottom panel) obtained from SCID mice injected with 4 × 10⁶ SKOV3 cells which were transfected with synthetic U12 snRNA, U6atac snRNA, or a GFP mRNA fragment (control). ClusterProfiler was used for functional enrichment analysis with all genes as background (B, C). A hypergeometric test was carried out, and all significant categories (false discovery rate < 0.05, after correction for multiple testing using the Benjamini–Hochberg procedure) are displayed. Source data are provided as a Source Data file.

