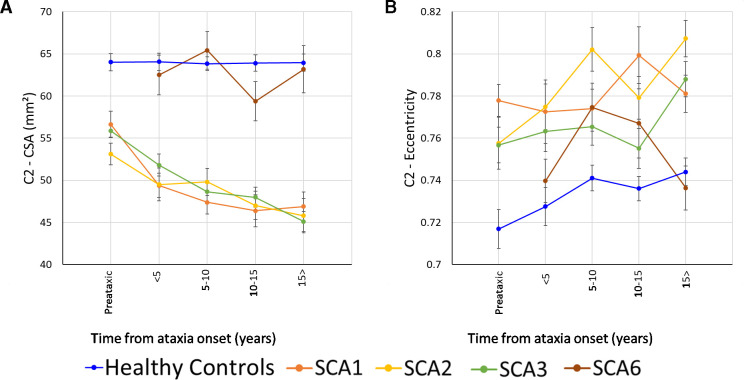
Figure 3.
Results showing the progressive atrophy of the (A) C2 CSA and (B) C2 eccentricity in participants with SCA1 (orange), SCA2 (yellow), SCA3 (green) and SCA6 (brown). Subgroups are defined based on time since ataxia onset. Preataxic: subjects with Scale for Assessment and Rating of Ataxia score <3 at the time of MRI assessment.29 The healthy controls were age-matched, sex-matched and site-matched for each SCA subgroup, with the plotted datapoint representing the mean cervical spinal cord area or eccentricity of all controls included in each subgroup; error bars=SE error of the mean. CSA, cross-sectional area; SCA, spinocerebellar ataxia.

