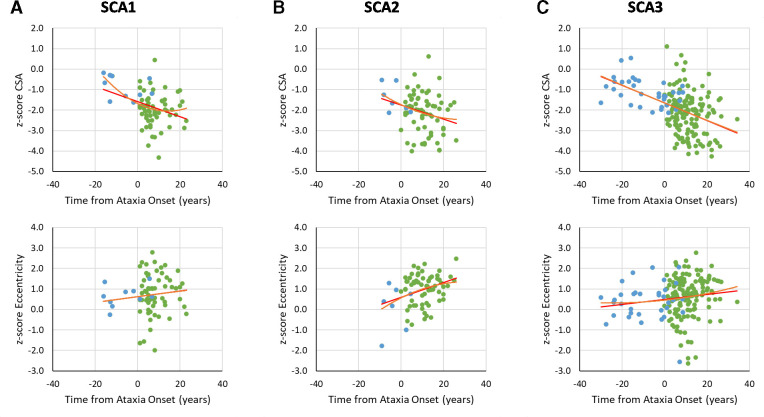
Figure 5.
Graphs of z-transformed CSA or eccentricity at the C2 vertebral level versus time from ataxia onset (green). The negative values (blue) for disease duration indicate the predicted time to ataxia onset calculated using Tezenas formulas for SCA1 and SCA223 and Peng formula for SCA3,27 based on CAG repeat length and current participant age. CSA, cross-sectional area; SCA, spinocerebellar ataxia.

