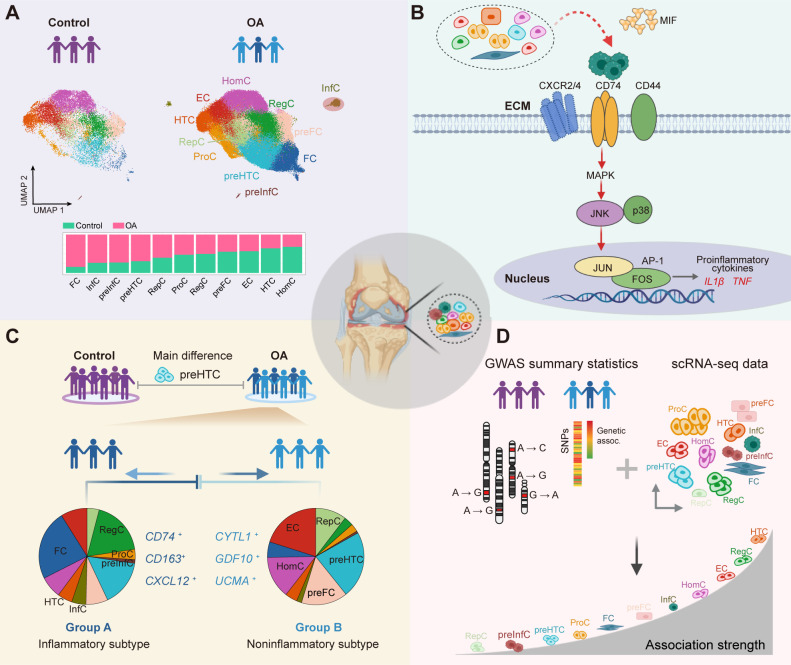
Figure 6.
The summary of the findings. (A) The cell fraction difference between patients with OA and non-OA controls. The InfC and preInfC are newly identified chondrocyte populations, which are largely absent in non-OA controls. (B) The MIF expressed by other chondrocytes interacts with the CD74-CXCR2/4-CD44 complex expressed by InfCs and activates the MAPK signalling pathway, which increases the expression of the activator protein 1 (AP-1) transcription factor and further promotes the transcription of pro-inflammatory cytokines. This figure was created by BioRender. (C) An integrative analysis of scRNA-seq data and bulk RNA-seq data demonstrates two major subtypes of patients with OA are stratified by preFC, resulting in an inflammatory-related subtype (group A) and a non-inflammatory-related subtype of OA (group B). (D) An integrative analysis of scRNA-seq data and GWAS summary data shows that HTC is the key chondrocyte population that drives the susceptibility to the pathogenesis of OA. CXCR2/4, C-X-C motif chemokine receptor 2/4; ECM, extracellular matrix; GWAS, genome-wide association studies; HTC, hypertrophic chondrocyte; InfC, inflammatory chondrocyte; MIF, macrophage migration inhibitory factor; MAPK, mitogen-activated protein kinase; OA, osteoarthritis; preFC, prefibrocartilage chondrocyte; preInfC, pre-inflammatory chondrocyte; scRNA-seq, single-cell RNA sequencing.

