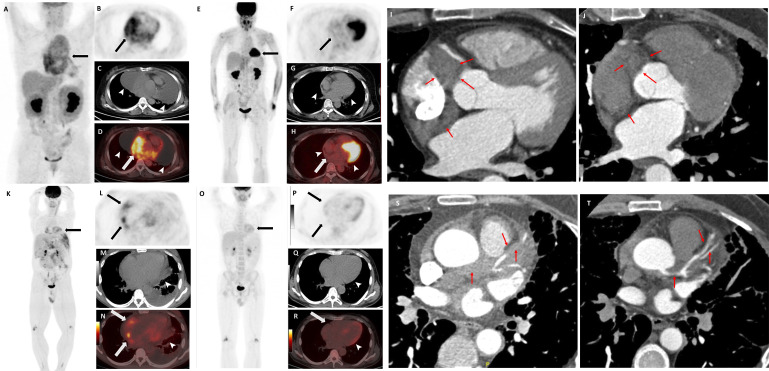
Figure 5.
Two patients achieved heart response including heart complete metabolic response (CMR) and pericardial effusion complete response and one patient achieved coronary artery stenosis rescued. (A) The maximal intensity projection (MIP) image showed the baseline 18F-fluorodeoxyglucose (FDG) uptake in the heart of patient 1 (arrow). The axial image (B: positron emission tomography (PET); C: CT; D: PET/CT fusion) showed the baseline FDG uptake of left atrium, interatrial septum, right atrium, right atrioventricular sulcus and pericardium (arrow), and large amount of effusion (arrowhead). (E) The MIP showed the post-treatment image of patient 1 (right ventricle physiological uptake was shown, arrow). The axial image (F: PET; G: CT; H: PET/CT fusion) showed heart CMR (arrow). The effusion totally disappeared (arrowhead). (I, J) Coronary artery CT angiography (CTA) showed the right atrioventricular sulcus pseudomass (red arrows) surrounding the beginning of coronary artery at baseline (I) and (J) after treatment. (K) The MIP showed the baseline FDG uptake in the heart of patient 2 (arrow). The axial image (L: PET; M: CT; N: PET/CT fusion) showed the baseline FDG uptake of left atrium, interatrial septum, right atrium, right atrioventricular sulcus (arrow) and mild effusion (arrowhead). (O) The MIP showed the post-treatment image of patient 2. The axial image (P: PET; Q: CT; R: PET/CT fusion) showed heart CMR (arrow). The mild effusion disappeared (arrowhead). (S, T). Coronary artery CTA showed the left anterior descending artery (red arrows) at baseline (S) and after treatment (T).

