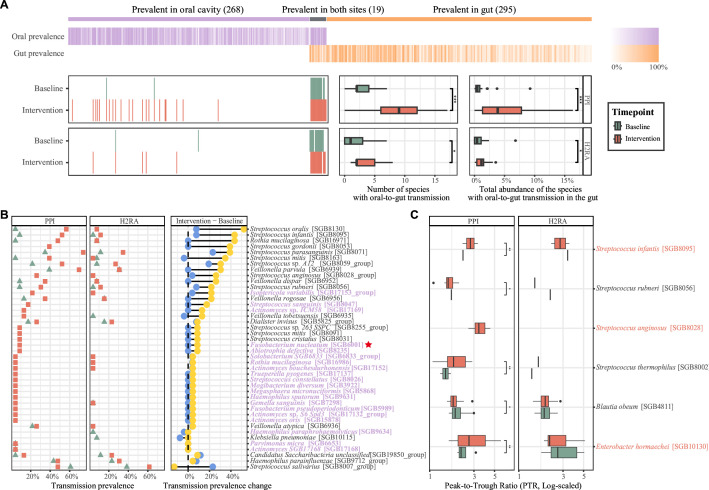
Figure 2.
PPI induces higher oral-to-gut transmission than H2RA and promotes the growth of transmitted species in the gut. (A) Prevalent species in the oral cavity, gut or both and their oral-to-gut transmission before and after the drug intervention. The top heatmap depicting the prevalence of species sorted from left to right in descending order of abundance (species prevalent in both sites were sorted based on their gut abundance). Species were divided into four categories using criteria defined by a previous study, including ‘faecal’ species (n=295, 50.69% of total) that were observed in >10% of faecal samples and <10% of saliva samples, ‘oral’ species (n=268, 46.05%) that were only prevalent in oral samples, and ‘both’ species (n=19, 3.26%) that were prevalent in >10% of saliva and stool samples. The heatmap in the bottom left displays all the species detected with oral-to-gut transmission at two timepoints in the PPI and H2RA group. The boxplot, sorted from left to right, compares the number and total abundance of species with oral-to-gut transmission before and after drug administration in the two groups. NS, not significant; *p<0.05; **p<0.01; ***p<0.001; ****p<0.0001. Wilcoxon rank-sum test. (B) Scatter plot showing the oral-to-gut transmission prevalence of the bacteria before and after the administration of PPI and H2RA drugs. The green triangle in the left two panels represents the oral-to-gut transmission prevalence of the bacteria at baseline, while the red square represents the transmission prevalence after intervention. The right panel summarises the change of the oral-to-gut transmission prevalence before and after the intervention in two groups. The grey labels indicate the ‘both’ species while purple labels indicate the ‘oral’ species defined in (A). Red star highlights Fusobacterium nucleatum, a well-studied marker of colorectal cancer according to previous studies.44 (C) Boxplot showing the species with significantly different bacterial growth rates (measured by peak-to-trough ratio) in the PPI group. The red labels indicate the PPI markers (ie, bacteria were significantly more abundant in the gut after the PPI usage compared with baseline). Wilcoxon rank-sum test was used to compare continuous variables between groups. NS, not significant; *p<0.05; **p<0.01; ***p<0.001; ****p<0.0001. H2RA, histamine-2 receptor antagonist; PPI, proton pump inhibitor.

