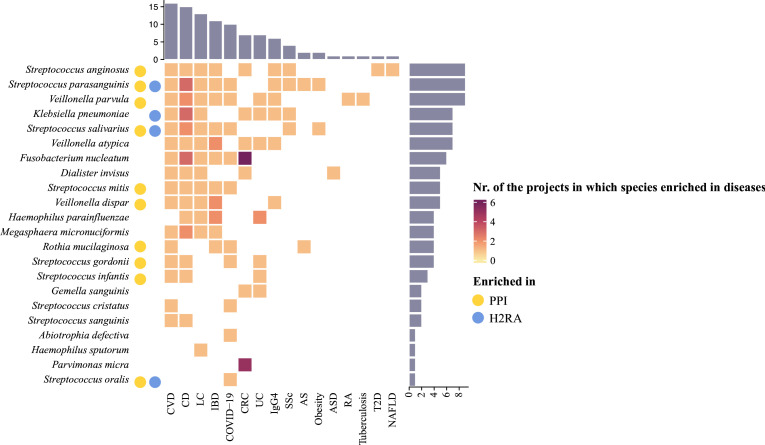
Figure 3.
Association between oral-to-gut transmitted species and disease risks according to the GMrepo database. Species that showed oral-to-gut transmission in at least one participant were shown. The heatmap shows the number of projects in which the corresponding species were enriched in the disease group according to the GMrepo database (see Methods section). The bar plot above the heatmap displays the total number of species enriched in each disease. The bar plot on the right displays the total number of diseases the corresponding species was enriched in. Yellow dots represent the species were PPI markers, and blue dots were H2RA markers. AS, ankylosing spondylitis; ASD, autism spectrum disorder; CD, Crohn’s disease; CRC, colorectal cancer; CVD, cardiovascular disease; H2RA, histamine-2 receptor antagonist; IBD, inflammatory bowel diseases; IgG4, immunoglobulin G4-related disease; LC, liver cirrhosis; NAFLD, non-alcohol fatty liver disease; PPI, proton pump inhibitor; RA, rheumatoid arthritis; SSc, systemic sclerosis; T2D, type 2 diabetes mellitus; UC, ulcerative colitis.

