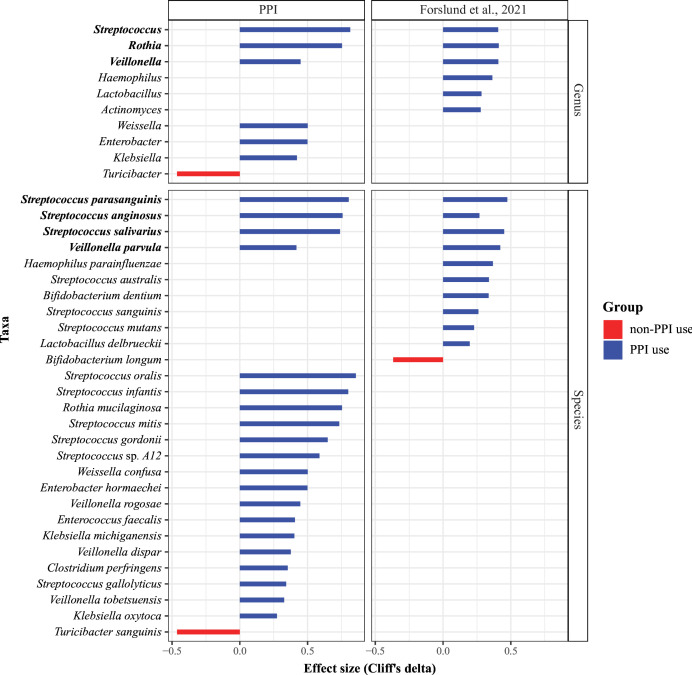
Figure 4.
Comparison of proton pump inhibitor (PPI) signatures in the gut identified in this study to those of the MetaCardis cohort. Bar plots show the magnitude and direction of effect size (Cliff’s delta) of PPI intervention on microbiome features. These effects are compared with the previously published data studied by Forslund et al.17 Taxon names in bold represent the enrichment direction of these taxa is consistent in both studies.

