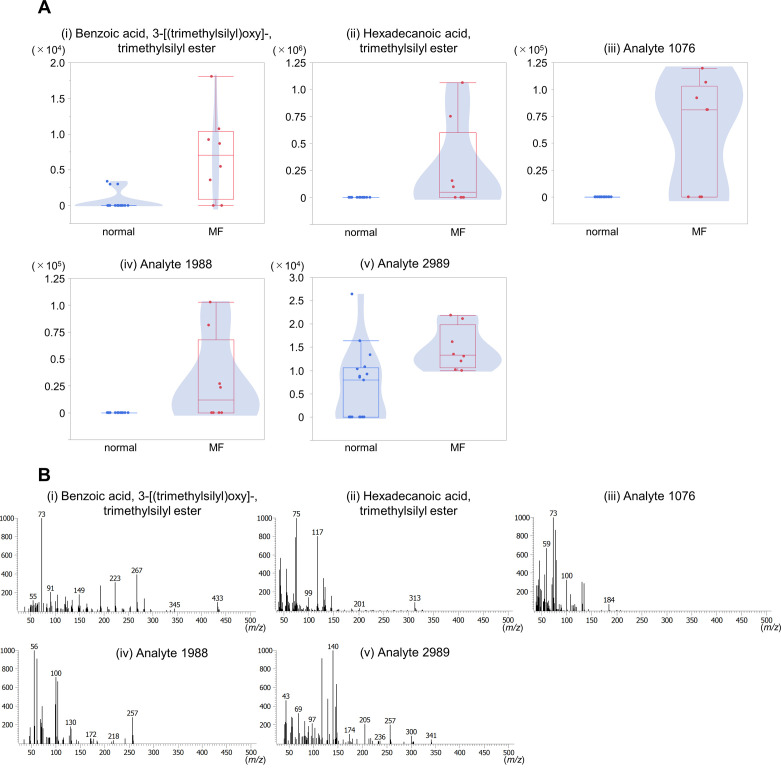
Fig. 3.
Comparison of peak areas of the 5 metabolites that exhibited significant variation between the milk fever and normal groups and their correlations with serum calcium concentration. (A) Box-and-whisker plots showing the median, interquartile range, and maximum and minimum values. The y-axis indicates the peak area of 5 metabolites. (B) Mass spectra of the 5 metabolites from the representative samples. (i) Benzoic acid, 3-[(trimethylsilyl) oxy]-, trimethylsilyl ester. (ii) Hexadecanoic acid, trimethylsilyl ester. (iii) Analyte 1076. (iv) Analyte 1988. (v) Analyte 2989.

