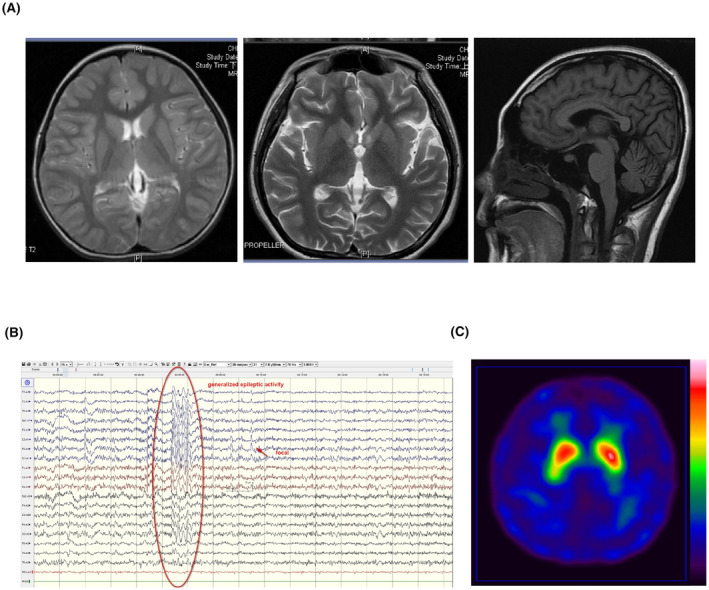
Figure 1.

Neuroimaging and electroencephalogram studies of the index patient with IRF2BPL c.379C>T (p.Gln127Ter) mutation. (A) T2‐weighted axial view and T1‐weighted sagittal view of brain MRI. (B) electroencephalogram. (C) 99mTc‐TRODAT single‐photon emission computed tomography scan.
