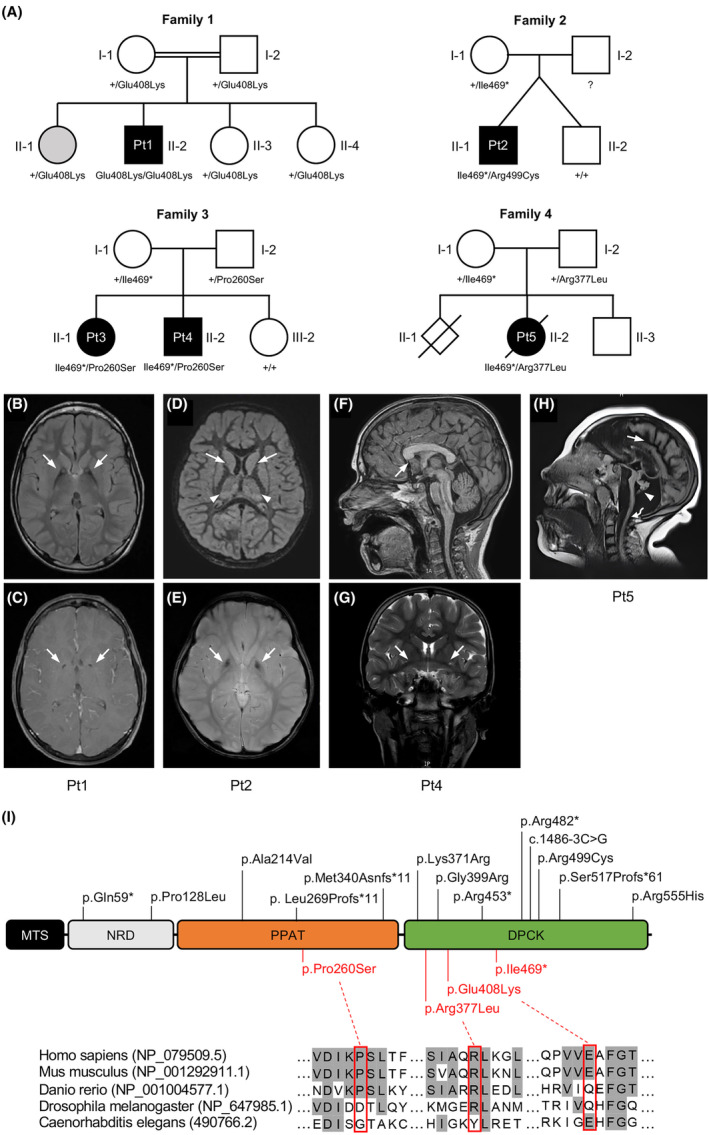
Figure 1.

Genetics and MRI of subjects affected by variants in COASY. (A) Pedigree of the four families showing the segregation of alleles. The variants status of affected and unaffected subjects is indicated by black and white symbols, respectively. Gray color in subject II‐1 from family 1 indicates an individual affected by Friedreich's Ataxia, but heterozygous for COASY variant. Genotype of subject I‐2 from family 2 is not available. (B–H) Brain MRI of affected subjects. (B) Bilateral T2 hyperintensity within the anteromedial region (arrows), and (C) small round area of T1 hypointensity in the center of the globus pallidus (arrows) in Pt1 at the age of 12 years. (D) T2‐weighted FLAIR hyperintensities within the bilateral basal ganglia and thalamic nuclei (arrows), and (E) T1 hypointensity in the center of the globus pallidus (arrows) in Pt2 at the age of 3 years. (F) MRI showing rostrum of the corpus callosum agenesis (arrow) and (G) prominent anterior commissure (arrows) in sagittal T1‐weighted and coronal T2‐weighted MRI, respectively, from Pt4 at 10 years old. (H) Sagittal T2‐weighted FLAIR from Pt5 at 5 years old showing a massive cerebral atrophy (arrow), marked cerebellum and pons atrophy (arrowhead), and significant trunk atrophy (curved arrow). (I) Schematic representation of COASY protein with functional regions, novel variants identified in this study (red), and already reported variants (black). DPCK, dephospho‐CoA kinase; MTS, mitochondrial targeting sequence; NRD, N‐terminus regulatory domain; PPAT, 4′‐phosphopantetheine adenylyltransferase. Amino acid sequence alignment showing conservation degree of novel missense variants across species.
