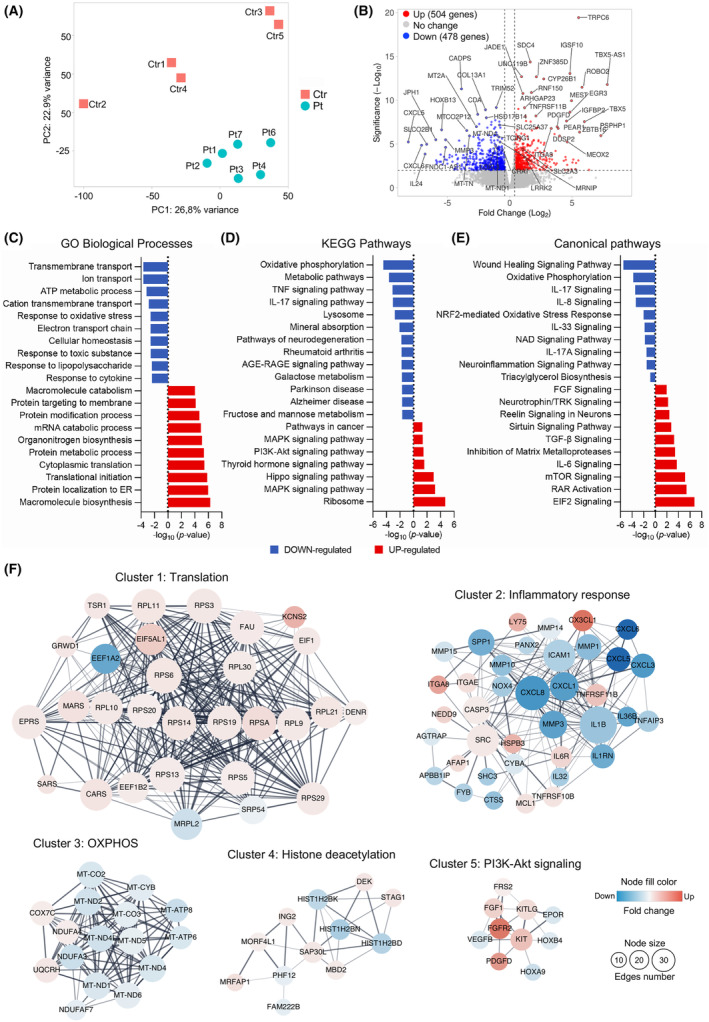
Figure 3.

Transcriptomic analysis in fibroblasts. (A) Principal component analysis (PCA) plot of RNA‐seq data, showing clear separation of patient‐derived fibroblast (turquoise) from controls (red). The two axes PC1 and PC2 represent the first two principal components identified by the analysis. (B) Volcano plots of the calculated DEGs. The number of the up‐regulated (red) and down‐regulated (blue) is indicated for log2FC >1 and p‐value <0.001. Top 50 DEGs are highlighted. (C–E) Selection of the most significantly enriched (C) GO biological process, (D) KEGG pathways, and (E) canonical pathways of DEGs, expressed as −log10 (p‐value). Down‐ and up‐regulated processes and pathways are colored in blue and red, respectively. (F) Results of protein–protein interaction (PPI) network analysis of common DEGs. The five top‐scored clusters. Red circles represent up‐regulated genes, and blue circles represent down‐regulated genes. The color depth represents the fold change of hub genes. The size of the nodes indicates the connections number of each gene.
