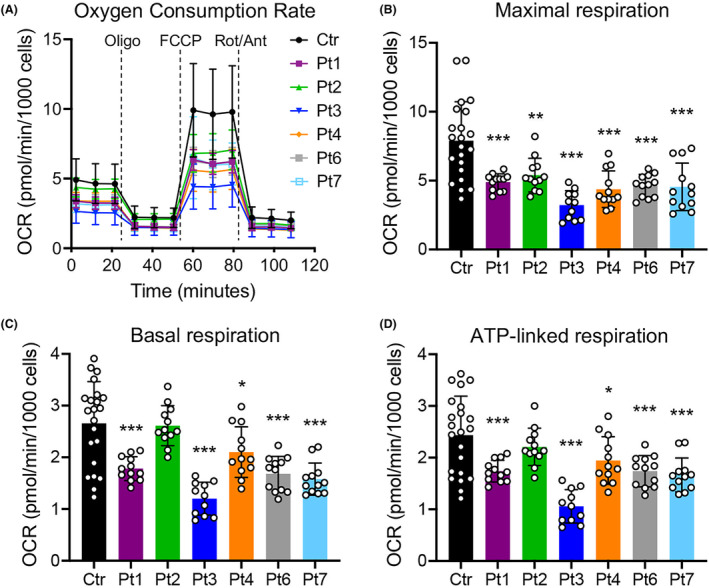
Figure 4.

Respiration profile of COASY mutated fibroblasts. (A) OCR of fibroblasts, expressed as pmoles O2/min/1000 cells, under basal conditions and after injection of oligomycin (Oligo), carbonyl cyanide 4‐(trifluoromethoxy) phenylhydrazone (FCCP), rotenone (Rot) and antimycin A (Ant). Data are shown as mean ± SD of three control lines (Ctr, n = 22) and patients' cells (Pt, n = 12). (B–D) Maximal (B), basal (C), and ATP‐linked (D) respiration were calculated from OCR traces and are reported in the graphs as mean ± SD. *p < 0.05; **p < 0.01; ***p < 0.001 (one‐way ANOVA).
