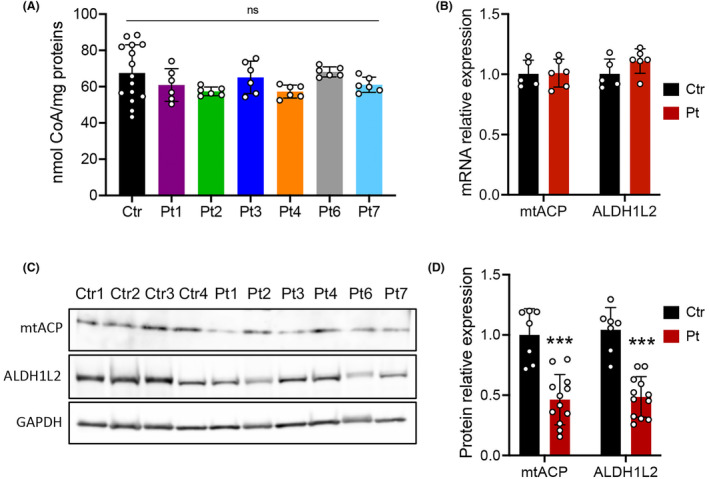
Figure 5.

Analysis of CoA and mitochondrial 4′‐phosphopantetheinyl proteins in COASY mutated fibroblasts. (A) Total cellular CoA measured in three control lines (Ctr, n = 15) and patients (Pt, n = 6) fibroblasts expressed as nmol/mg of proteins. Data are shown as mean ± SD. *p < 0.05; **p < 0.01; ***p < 0.001 (one‐way ANOVA). (B) Relative amount of mtACP and ALDH1L2 transcripts assessed by qPCR. (C) Representative immunoblot and (D) densitometric quantification of mtACP and ALDH1L2 proteins in fibroblast from controls (Ctr) and patients (Pt) derived from two independent experiments. An antibody against GAPDH was used as control. Mean ± SD is shown. ***p < 0.001 (unpaired Student's t‐test).
