Figure 4.

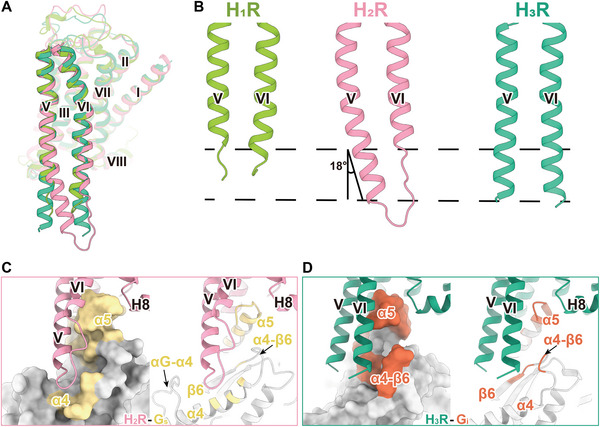
Structural comparison of histamine receptor–G‐protein complexes. A) Structural superposition of the active models of H1R, H2R, and H3R. B) Comparison of TM5 and TM6 in H1R‐Gq, H2R‐Gs, and H3R‐Gi complexes. C,D) Surface (left) and cartoon (right) representation of binding area of H2R (C) and H3R (D) with their respective coupled Gα subunit. Residues within 4Å of H2R or H3R in Gαs or Gαi are highlighted in yellow or orange, respectively.
