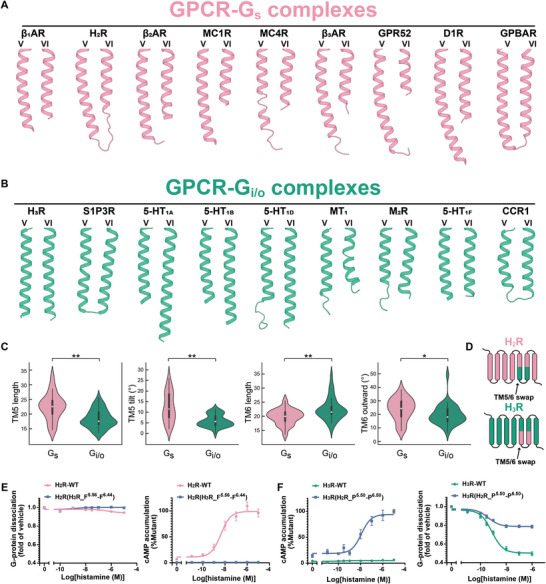
Figure 5.

TM5 and TM6 are responsible for Gs and Gi selectivity. A) Representative of the TM5/TM6 structural geometry of Gs‐coupled receptors. B) Representation of the TM5/TM6 structural geometry of Gi‐coupled receptors. C) Violin plots depicting four distinct features of TM5/TM6 in Gs‐ and Gi/o‐coupled receptors. The white dot denotes the median. The interquartile range is shown by the broad black bar in the middle. Except for points considered to be “outliers” using an interquartile range‐based technique, the thin line reflects the remainder of the distribution. n = 54, ns P > 0.05, *P < 0.05, **P < 0.01 by Mann‐Whitney U test. D) Schematic representation of the “TM5/TM6 swap” experiments. E–F) Dose‐dependent curves for histamine induced G‐protein dissociation and cAMP accumulation in HEK293 cells expressing chimera receptors (n = 3). E) Replacement of I5.56‐F6.44 of H2R with F5.56‐F6.44 of H3R did not confer the ability to dissociate Gi‐protein (left), but resulted in loss of the ability to activate the Gs signal pathway (right). F) Replacement of P5.50‐P6.50 of H3R with P5.50‐P6.50 of H2R resulted in gain of the ability to activate the Gs signal pathway (left), but loss of the ability to dissociate Gi‐protein (right).
