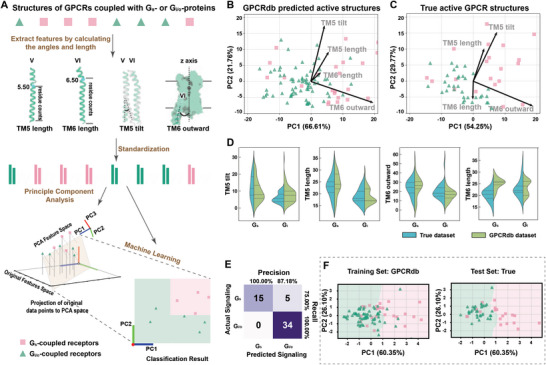
Figure 6.

Machine learning‐based classification of GPCRs into Gs and Gi signaling pathway. A) Workflow for GPCR classification utilizing machine learning and feature pre‐processing. The length and tilt of TM5, as well as the length and outward movement of TM6 are extracted from active GPCR structures obtained from GPCRdb homology models and True structures. The resulting data of these four geometries are standardized, and then subjected to PCA. Subsequently, a Random Forest classifier is employed to classify GPCRs based on the PCA results. B,C) PCA biplots were generated for the four geometries of GPCRdb homology models (B) and True GPCR structures (C) individually. The contributions of each variable to the principal components are depicted as vectors on the plot, where the vertical component of a vector on a given PC illustrates the respective contribution of that variable to the PC. The angle between two vectors reflects the correlation between the corresponding features, while the length of a vector represents the significance of the corresponding feature. D) Comparison of violin plots depicting four geometries of TM5/TM6 in GPCRdb structures and True GPCR structures. Here the median and interquartile range are depicted as dashes. E) Confusion matrix for the True GPCR structures given by the best classifier. F) Decision boundary visualization via PCA given by the best classifier and scatter plot of GPCRdb homology models (left) and True GPCR structures (right) based on GPCRdb homology models.
