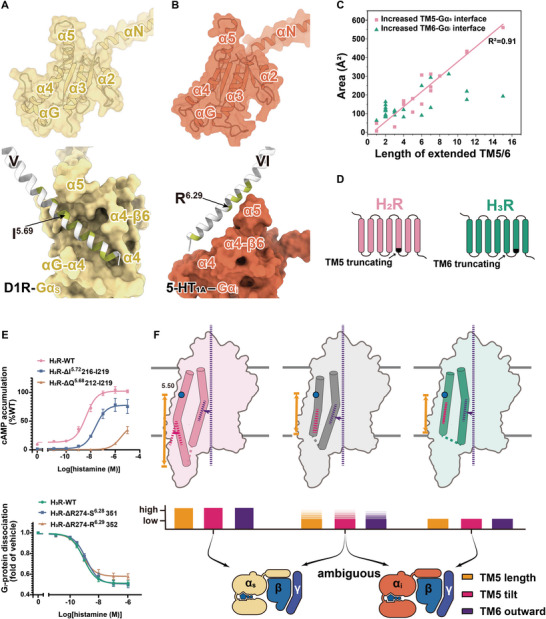
Figure 7.

Contributions to G‐protein signaling of extended TM5/TM6. A) (Up) Surface and cartoon representations of Gαs are shown, with the surface of Gαs depicted as transparent. (Down)The binding surface of TM5 with Gαs of D1R is shown, with TM5 beyond I5.69 noted as extended helix. Residues that interact with Gα are highlighted in green. B) (Up)Surface and cartoon representations of Gαi are shown, with the surface of Gαi depicted as transparent. (Down) The binding surface of TM6 with Gαi/o of 5‐HT1A. TM6 beyond R6.29 was considered as extended helix. C) The additional contact areas of Gs‐ or Gi/o‐coupled receptors between the extended TM5/TM6 with Gαs/Gαi/o, respectively. D) Schematic representation of the TM5‐ (up) or TM6‐ (down) breaking mutants. E) Dose‐dependent curves for histamine induced cAMP accumulation or G‐protein dissociation in HEK293 cells expressing the truncated receptors (n = 3). (Up) The TM5 of H2R was respectively truncated by four amino acids and eight amino acids. The cAMP assay validated that the length of TM5 was closely related to the activation of the Gs signal pathway. (Down) The TM6 of H3R was respectively truncated by eight amino acids and nine amino acids. The NanoBit assay validated that the length of TM6 did not correlate with the dissociation of the Gi‐protein. F) Schematic representation of the geometry determinants for G‐protein selectivity of GPCRs.
