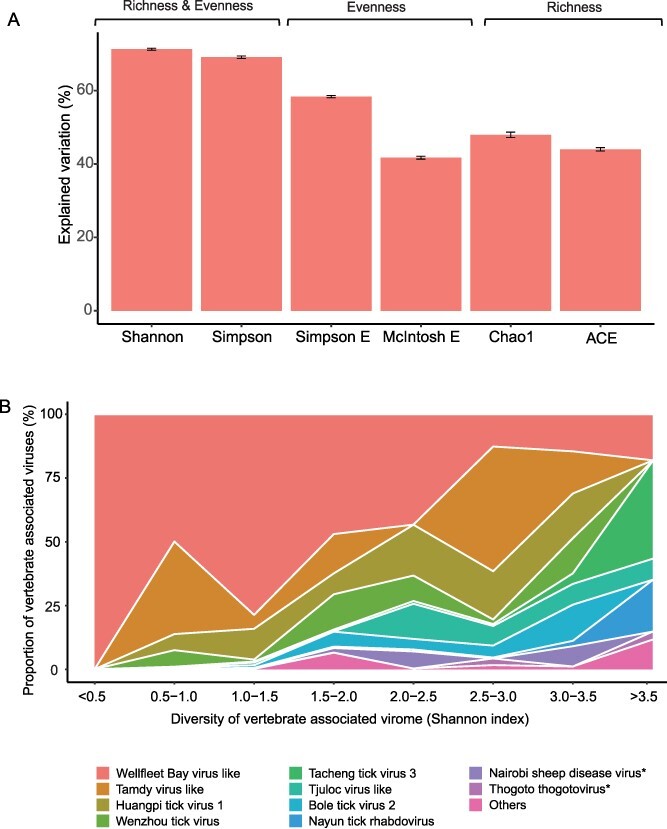
Figure 3.

(A) Explained variation of ecoclimate factors by GAM under six index measurements of virome diversity. All ecoclimate factors were included to fit a joint model for six virome diversity index values, successively. (B) Proportions of the 10 virus species with the largest abundance in different virome diversity groupings (by Shannon index). Pathogenic virus is indicated by asterisk. ***P < .001; **P < .01; *P < .05.
