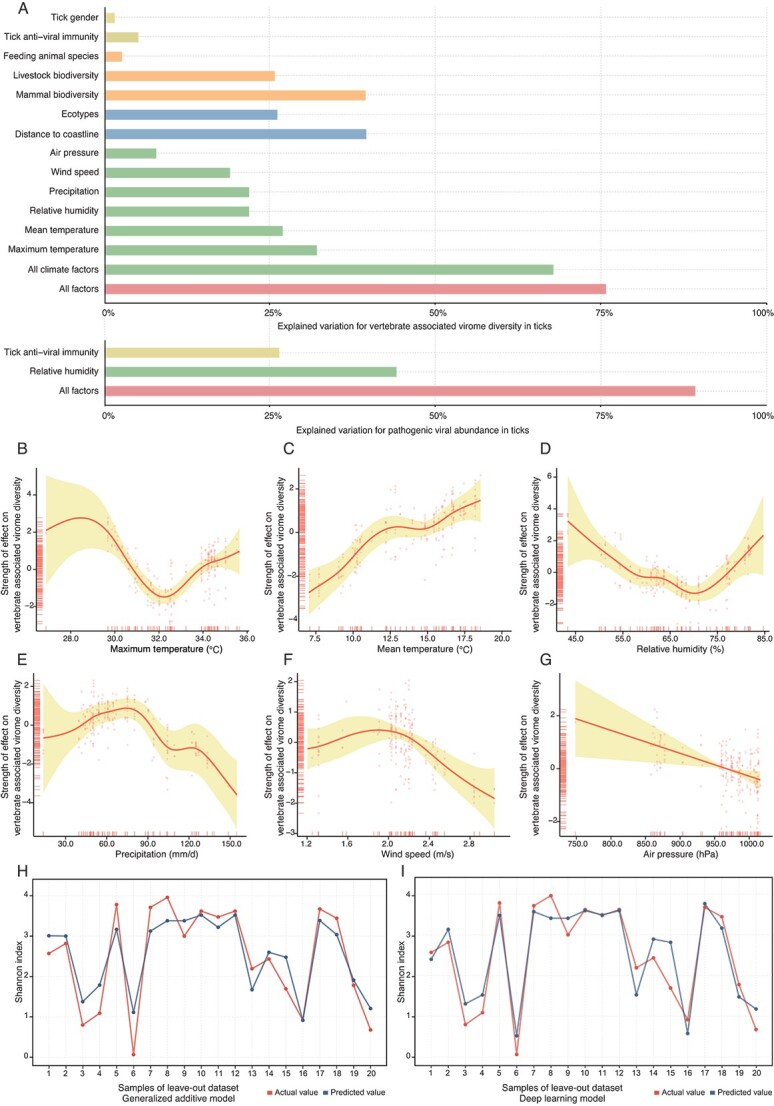
Figure 4.

The effects of ecoclimate factors that explain the vertebrate-associated virome diversity and viral abundance of human pathogenic viruses under the GAM. (A) Explained variation of vertebrate-associated virome diversity and human pathogenic viral abundance for all ecoclimate factors. Each ecoclimate factor was individually fitted to the model for vertebrate-associated virome diversity or pathogenic viral abundance. (B-G) Partial effect plots showing the relative effect of each variable for vertebrate-associated virome diversity (Shannon index). All ecoclimate factors were included to fit the best-fit GAM model. Shaded area is the 95% confidence interval of the mean partial effect. (H) Actual Shannon index and predicted Shannon index using the GAM model. (I) Actual Shannon index and predicted Shannon index using the deep learning model.
