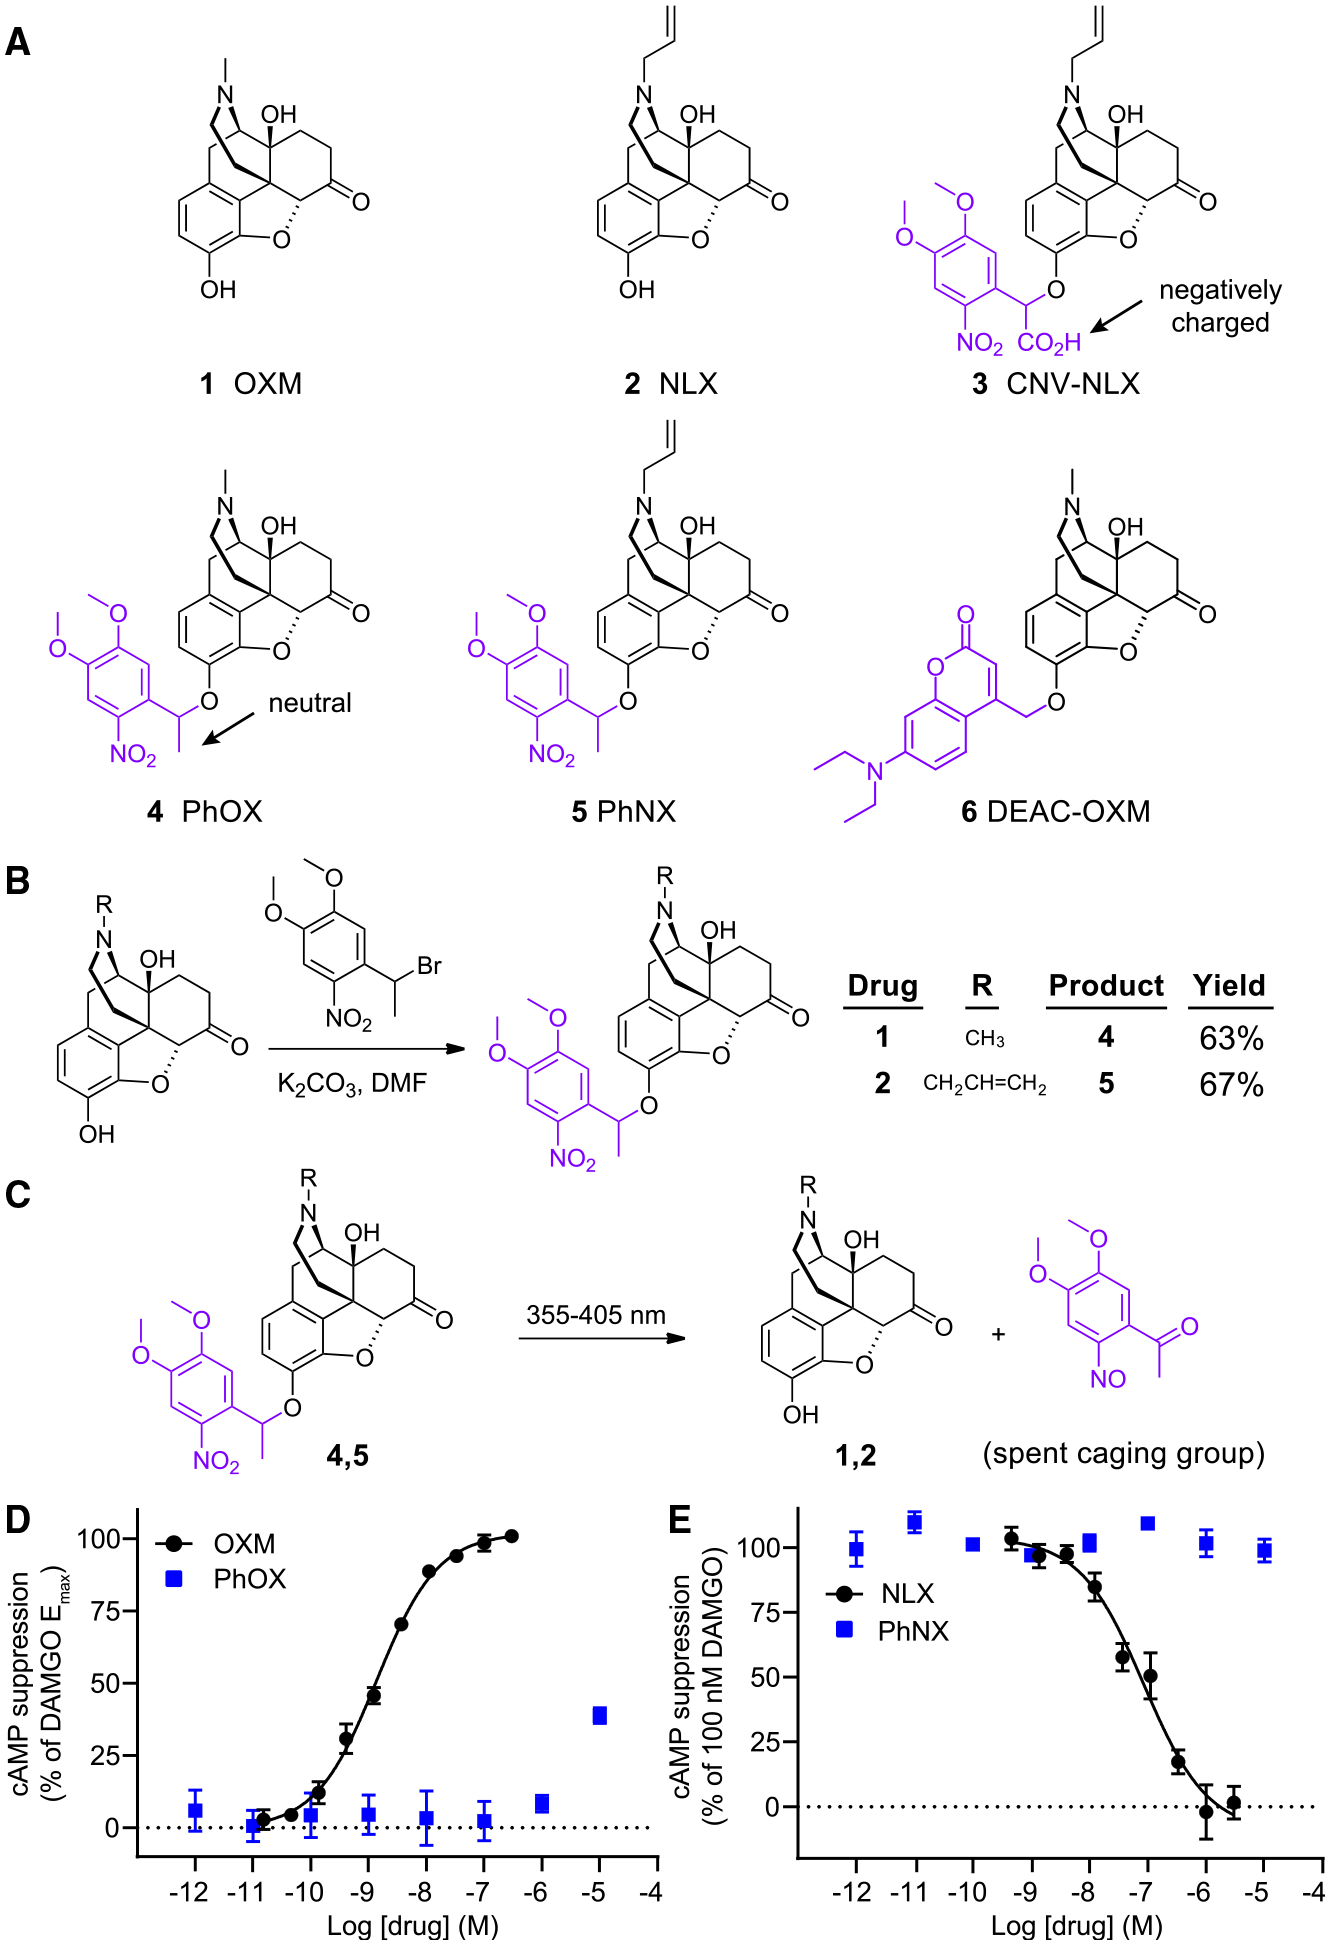
Figure 1. Design, synthesis, and in vitro validation of PhOX and PhNX.

(A) Chemical structures of OXM (1), NLX (2), and the photoactivatable small molecule opioid drugs CNV-NLX (3), PhOX (4), PhNX (5), and DEAC-OXM (6). The light-removable DMNPE and DEAC caging groups are drawn in violet.
(B) Reaction scheme depicting the one-step alkylation procedure used to synthesize PhOX and PhNX.
(C) Reaction scheme depicting ultraviolet-light-driven photorelease of OXM and NLX from PhOX, and PhNX, respectively.
(D) Agonist dose-response curves at the MOR using a cAMP assay. The solid line depicts the best-fit sigmoidal function used to derive the indicated EC50 value. Data were normalized to the response produced by DAMGO (1 μM) and are expressed as mean ± SEM (n = 5 wells per concentration).
(E) Antagonist dose-response curves at the MOR in the presence of DAMGO (100 nM). Data are presented as in (D). See also Figures S1–S3.
