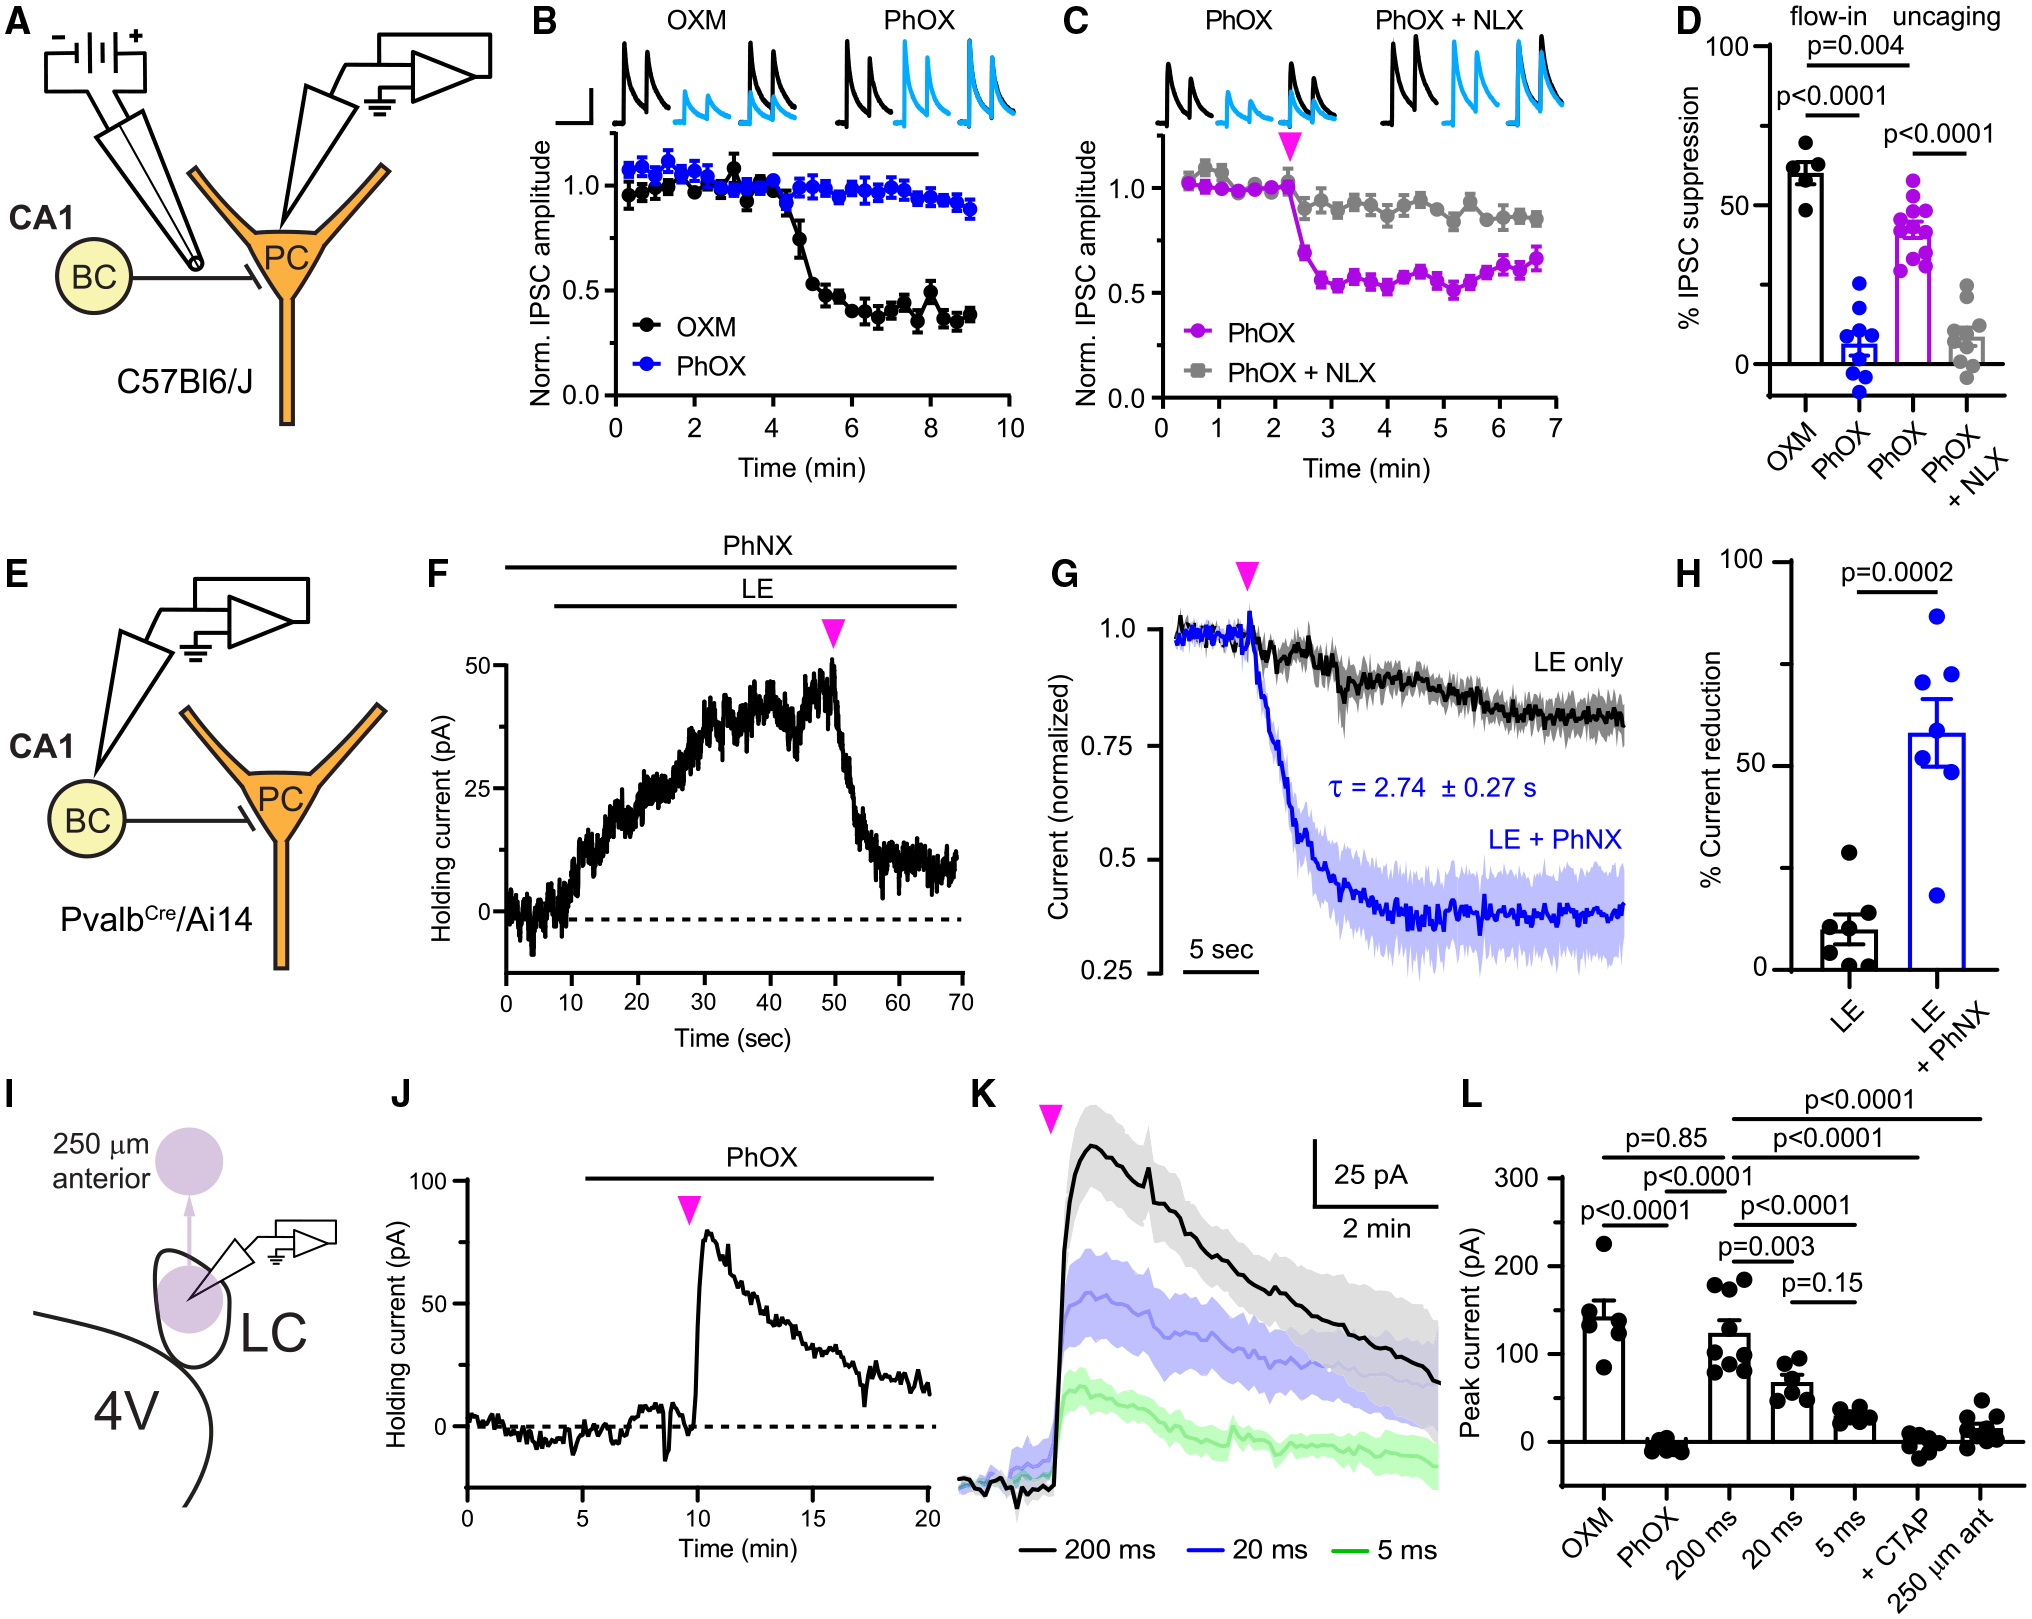
Figure 2. Evaluation of PhOX-mediated photo-agonism and PhNX-mediated photo-antagonism in acute brain slices.

(A) Schematic depicting whole-cell voltage clamp recording of opioid-sensitive synaptic inhibition in the hippocampus. BC, basket cell; PC, pyramidal cell.
(B) Baseline-normalizedIPSCs in response to bath application of drug, as indicated by the black line (OXM: n = 5 cells from 2 mice; PhOX: n = 9 cells from 6 mice). Top insets: example average IPSCs (n = 3 sweeps from one cell) before (black) and after (blue) drug application. Scale bars, 200 pA, 80 ms.
(C) IPSC suppression in response to uncaging with a full-field flash of UV light (pink arrow) (PhOX: n = 12 cells from 7 mice; PhOX + NLX: n = 10 cells from 5 mice).
(D) Summary data for (B) and (C) (one-way ANOVA, F(3,32) = 58.2, p < 0.0001, Bonferroni’s multiple comparisons test).
(E) Schematic depicting the whole-cell voltage clamp recording of outward currents from BCs.
(F) Example recording demonstrating photoinhibition of the current evoked by bath application of LE upon PhNX uncaging. Scale bars, 10 pA, 10 s.
(G) Normalized response of LE-evoked currents to a UV light flash in the absence and presence of PhNX (LE only: n = 7 cells from 3 mice; LE + PhNX: n = 7 cells from 3 mice).
(H) Summary of the LE-evoked current remaining 10–15 s after application of a light flash (unpaired two-tailed t test).
(I) Schematic depicting whole-cell voltage clamp recording from noradrenergic neurons in rat LC and movement of the uncaging spot (purple circle) away from the recorded neurons.
(J) Example recording from an LC neuron in which bath application of PhOX was followed by uncaging.
(K) Average currents evoked by uncaging PhOX with light flashes of varied duration (200 ms: n = 9 cells from 3 rats; 20 ms: n = 6 cells from 3 rats; 5 ms: n = 6 cells from 3 rats).
(L) Summary of the currents evoked in LC neurons (one-way ANOVA, F(6,42) = 33.6, p < 0.0001, Sidak’s multiple comparisons test). All data are plotted as mean ± SEM. See also Figure S3.
