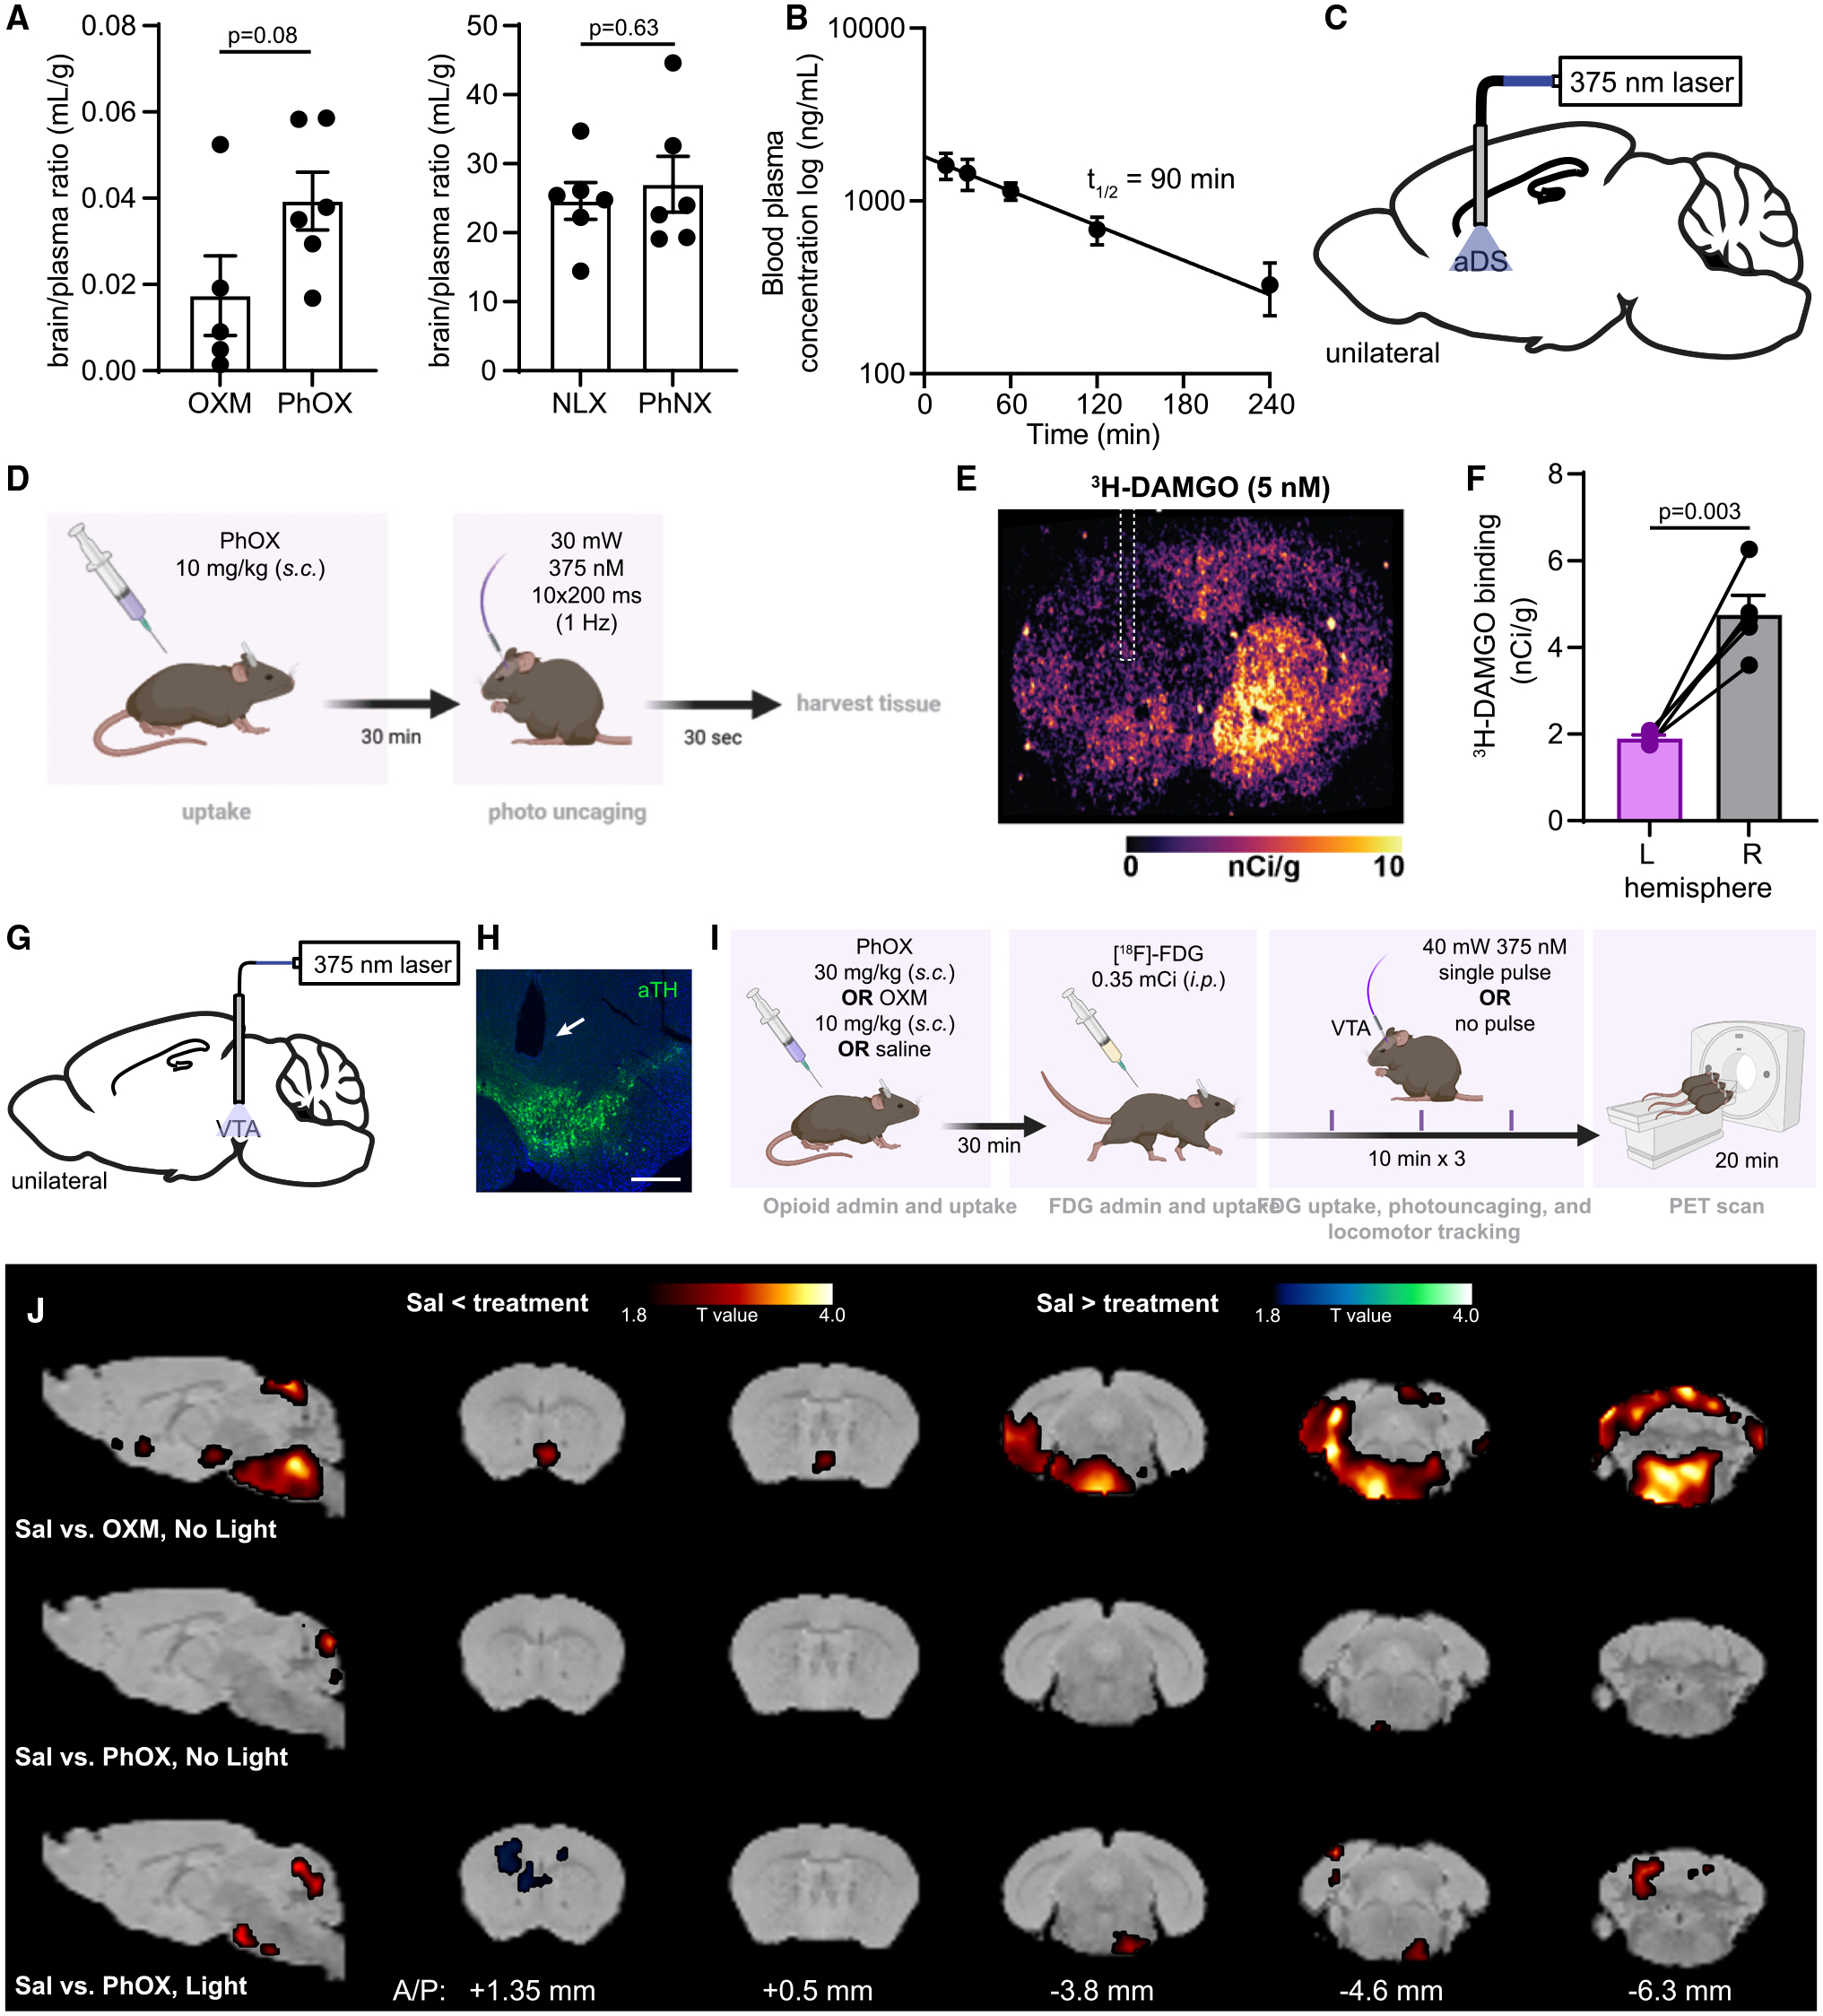
Figure 3. In vivo photoactivation of PhOX after systemic administration.

(A) Brain/plasma ratios determined 15 min after administration (n = 5–6 mice per condition, unpaired two-tailed t test). Data are plotted as mean ± SEM.
(B) Time course of PhOX clearance from the bloodstream (15 mg/kg, n = 4 mice). Data are plotted as mean ± SEM.
(C) Schematic indicating the implantation of an optical fiber in the aDS.
(D) Experimental timeline for in vivo uncaging followed by autoradiography.
(E) Autoradiographic image of the fiber implant site in mice.
(F) Quantification of [3H]-DAMGO binding in the illuminated (L) and unilluminated (R) hemispheres (n = 5 sections from 5 mice, paired two-tailed t test). Data are plotted as mean ± SEM.
(G) Schematic indicating the implantation of an optical fiber above the VTA.
(H) Representative fluorescence image of the VTA implant site (scale bars, 0.5 mm).
(I) Schematic depicting the experimental protocol for PET imaging after PhOX uncaging.
(J) Brain-wide voxel-based analysis of [18F]-FDG uptake. Color shaded areas overlaid on the corresponding sections of a brain atlas31 represent clusters of voxels (R100) with significant (p < 0.05) increases or decreases in FDG accumulation compared with saline (n = 5–6 mice per condition).
