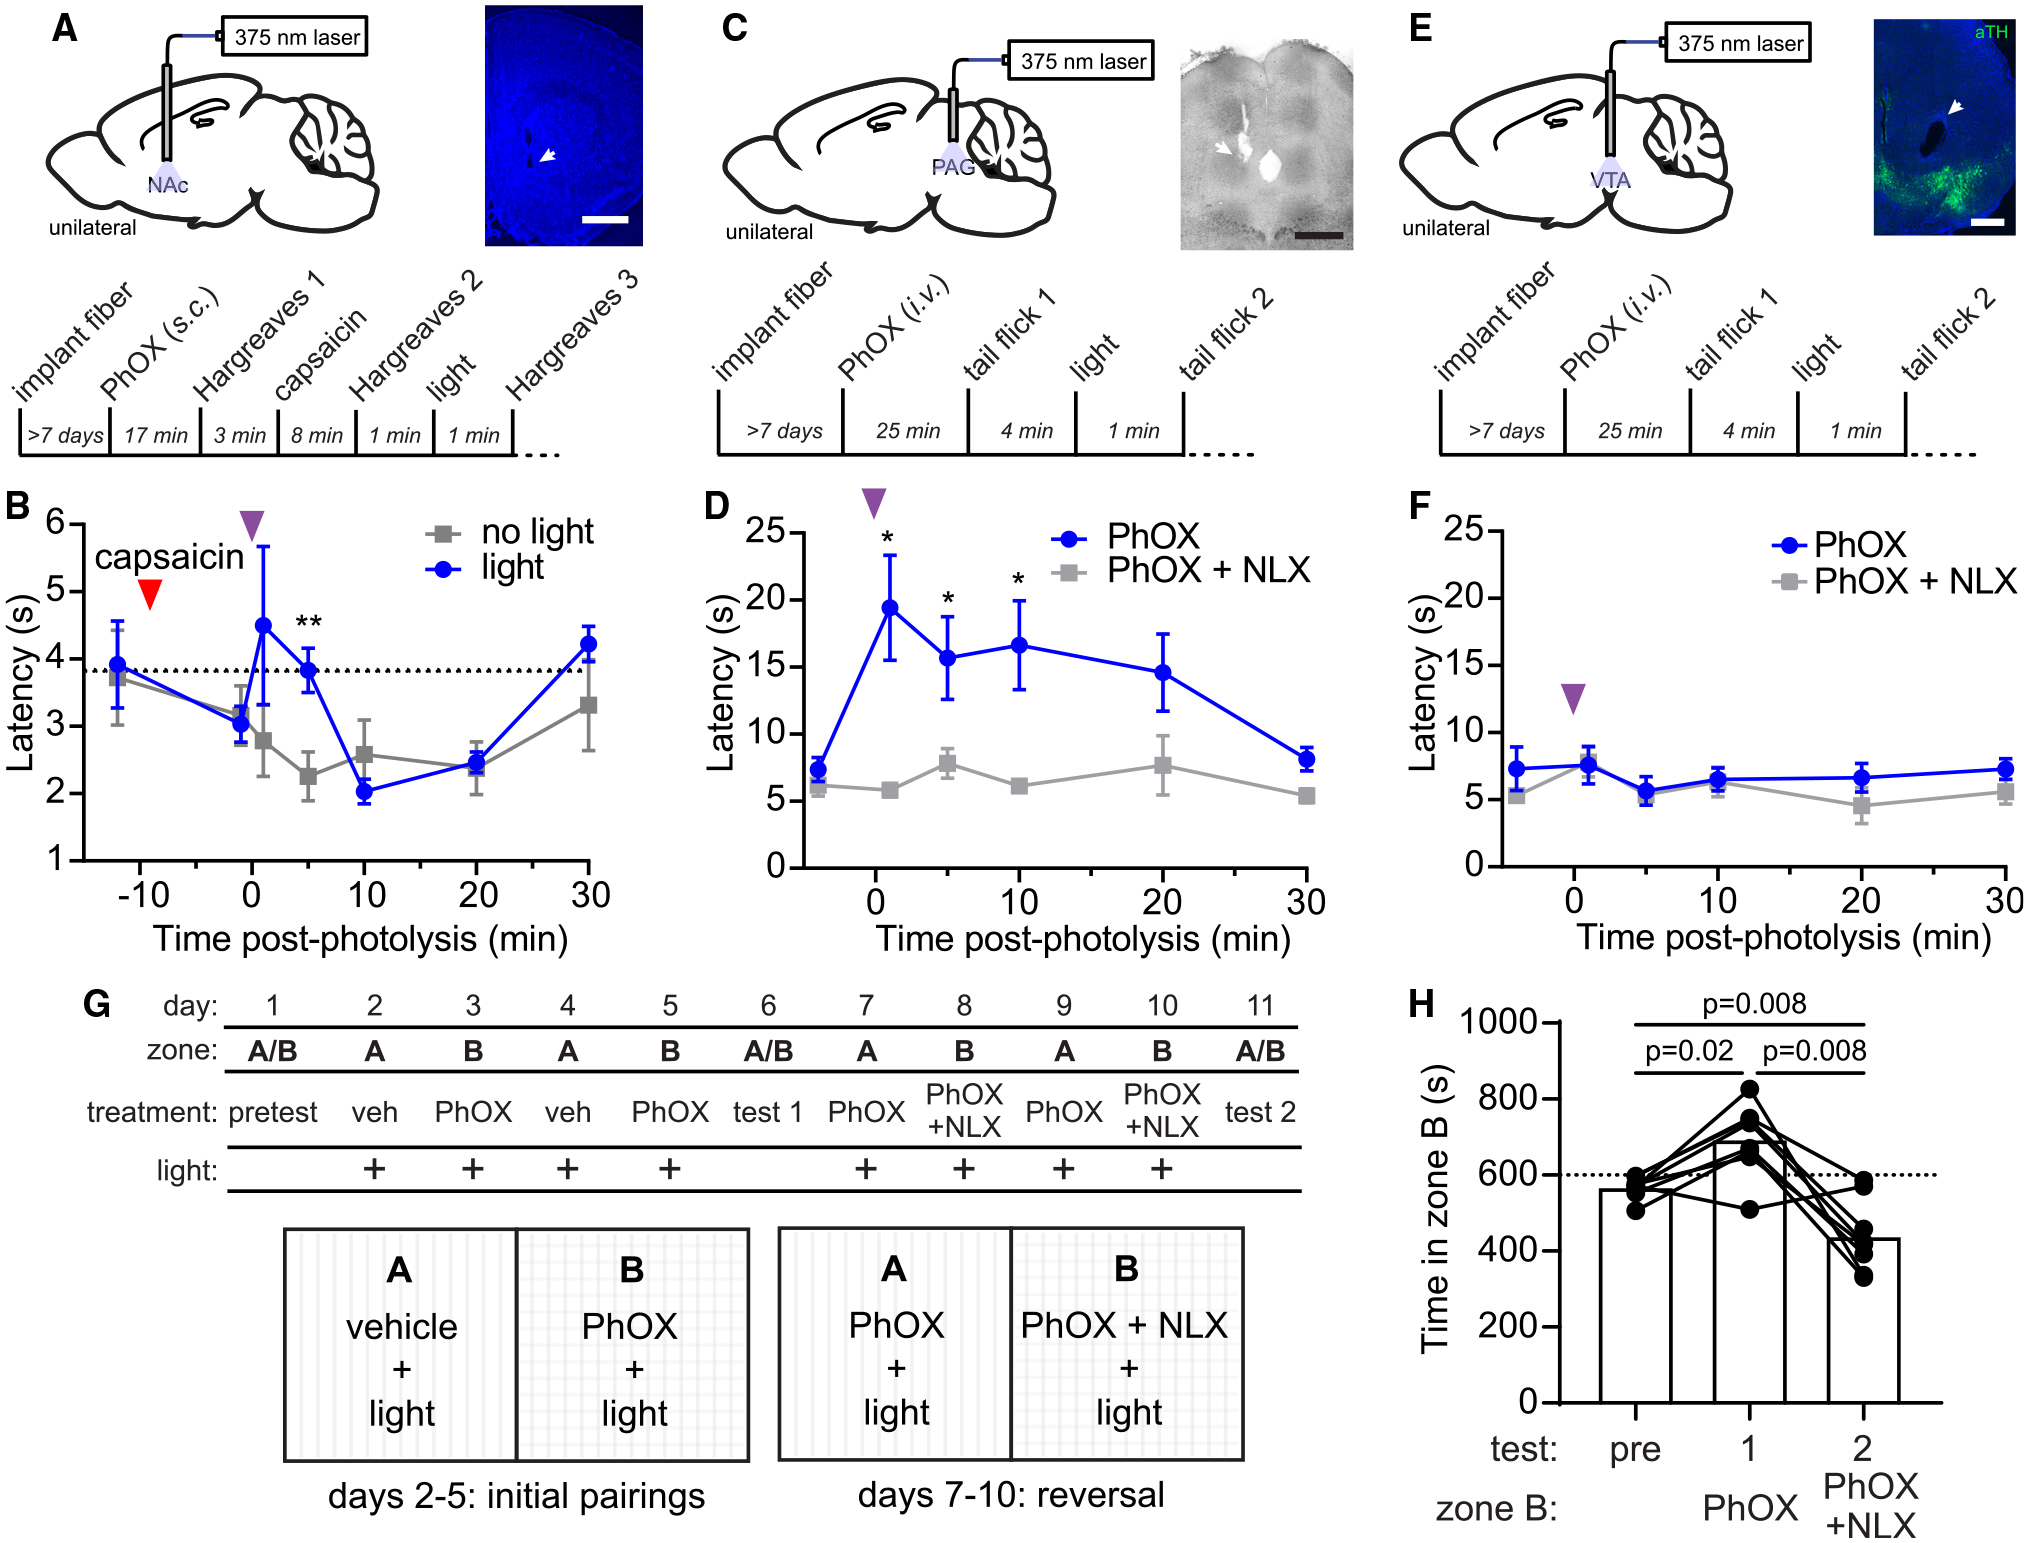
Figure 4. In vivo photoactivation of PhOX suppresses pain-related behavior and drives behavioral reinforcement.

(A) Schematic indicating the implantation of an optical fiber in the NAc-mSh (top left), representative fluorescence image of the optical fiber implant site (scale bars, 1 mm) (top right), and experimental timeline (bottom).
(B) Paw withdrawal latency in the Hargreaves assay (n = 6 mice, ** indicates p < 0.005, paired two-tailed t test).
(C) Same as (A) for the PAG (scale bars, 0.5 mm).
(D) Withdrawal latency in the tail flick assay (n = 6 mice, * indicates p < 0.05, Wilcoxon signed-rank test).
(E) Same as (A) for the VTA (scale bars, 0.5 mm).
(F) Withdrawal latency in the tail flick assay (n = 4 mice, no significant differences detected, Mann-Whitney test).
(G) Schematic depicting the CPP protocol.
(H) Time spent in zone B on test days (n = 8 mice, repeated measures one-way ANOVA, F(1.13,7.88) = 19.4, p = 0.002, Bonferroni’s multiple comparisons test). All data are plotted as mean ± SEM. See also Figure S4.
