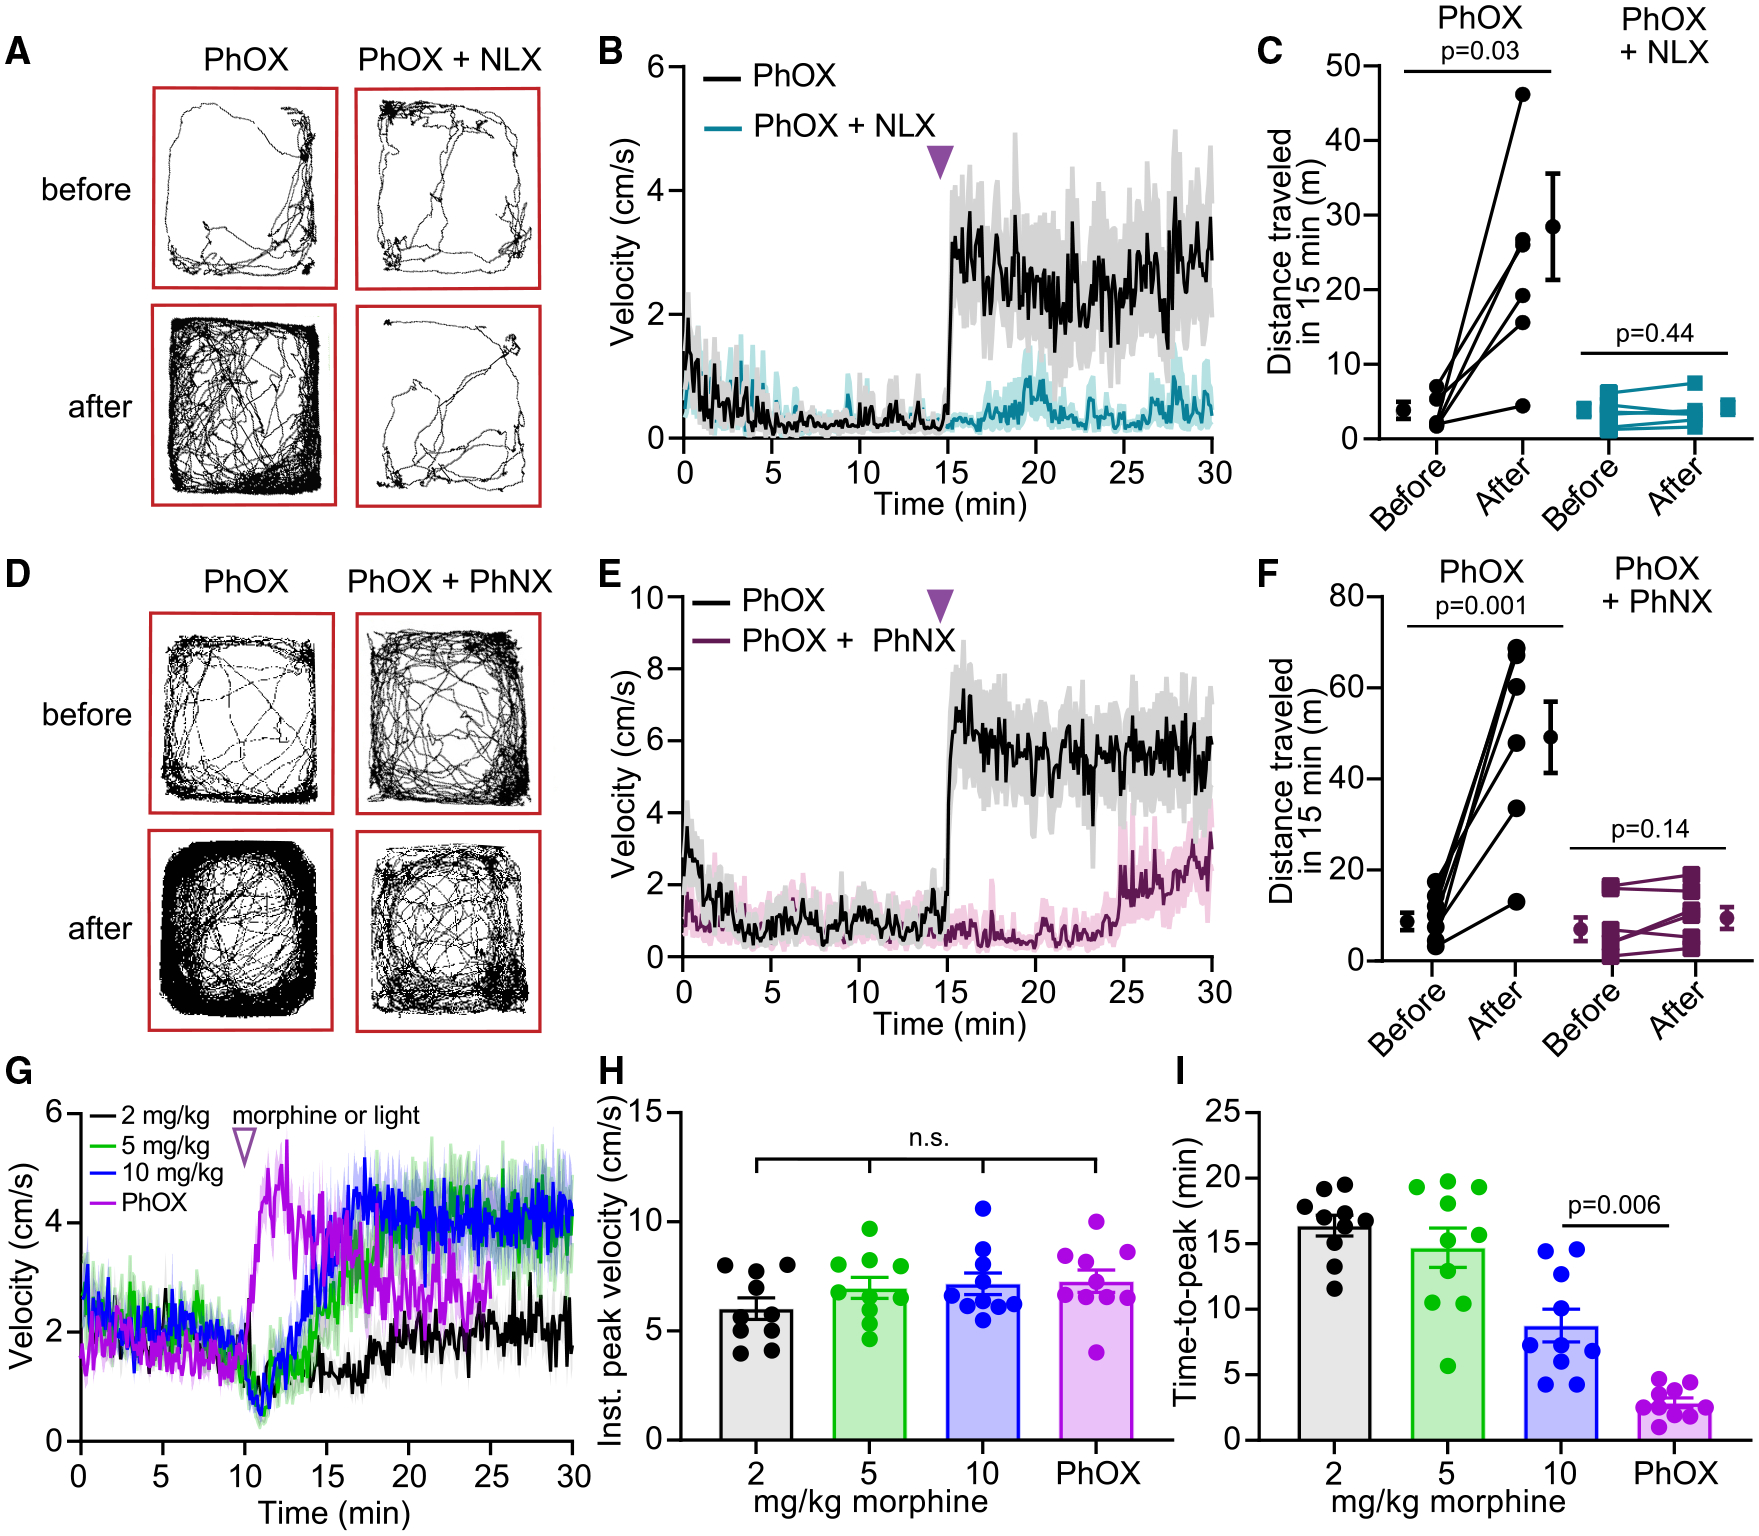
Figure 5. In vivo photoactivation of PhOX in the VTA drives rapid locomotor activation.

(A) Example maps of open field locomotor activity.
(B) Plot of average velocity over time (n = 6 mice).
(C) Summary plot of the total distance traveled before or after photoactivation (n = 6 mice, Wilcoxon signed-rank test).
(D) Same as (A).
(E) Same as (B) (n = 7 mice).
(F) Same as (C) (n = 7 mice, paired two-tailed t test).
(G) Same as (B) but comparing PhOX photoactivation to systemic morphine (n = 10 mice).
(H) Summary plot of the instantaneous peak velocity reached after morphine injection or PhOX photoactivation (n = 10 mice, repeated measures one-way ANOVA, F(2.2, 19.3) = 2.33, p = 0.12).
(I) Summary plot of the time to reach the peak locomotor response (n = 10 mice, repeated measures one-way ANOVA, F(1.9, 16.9) = 36.12, p < 0.0001, Tukey’s multiple comparisons test). All data are plotted as mean ± SEM. See also Figure S5.
