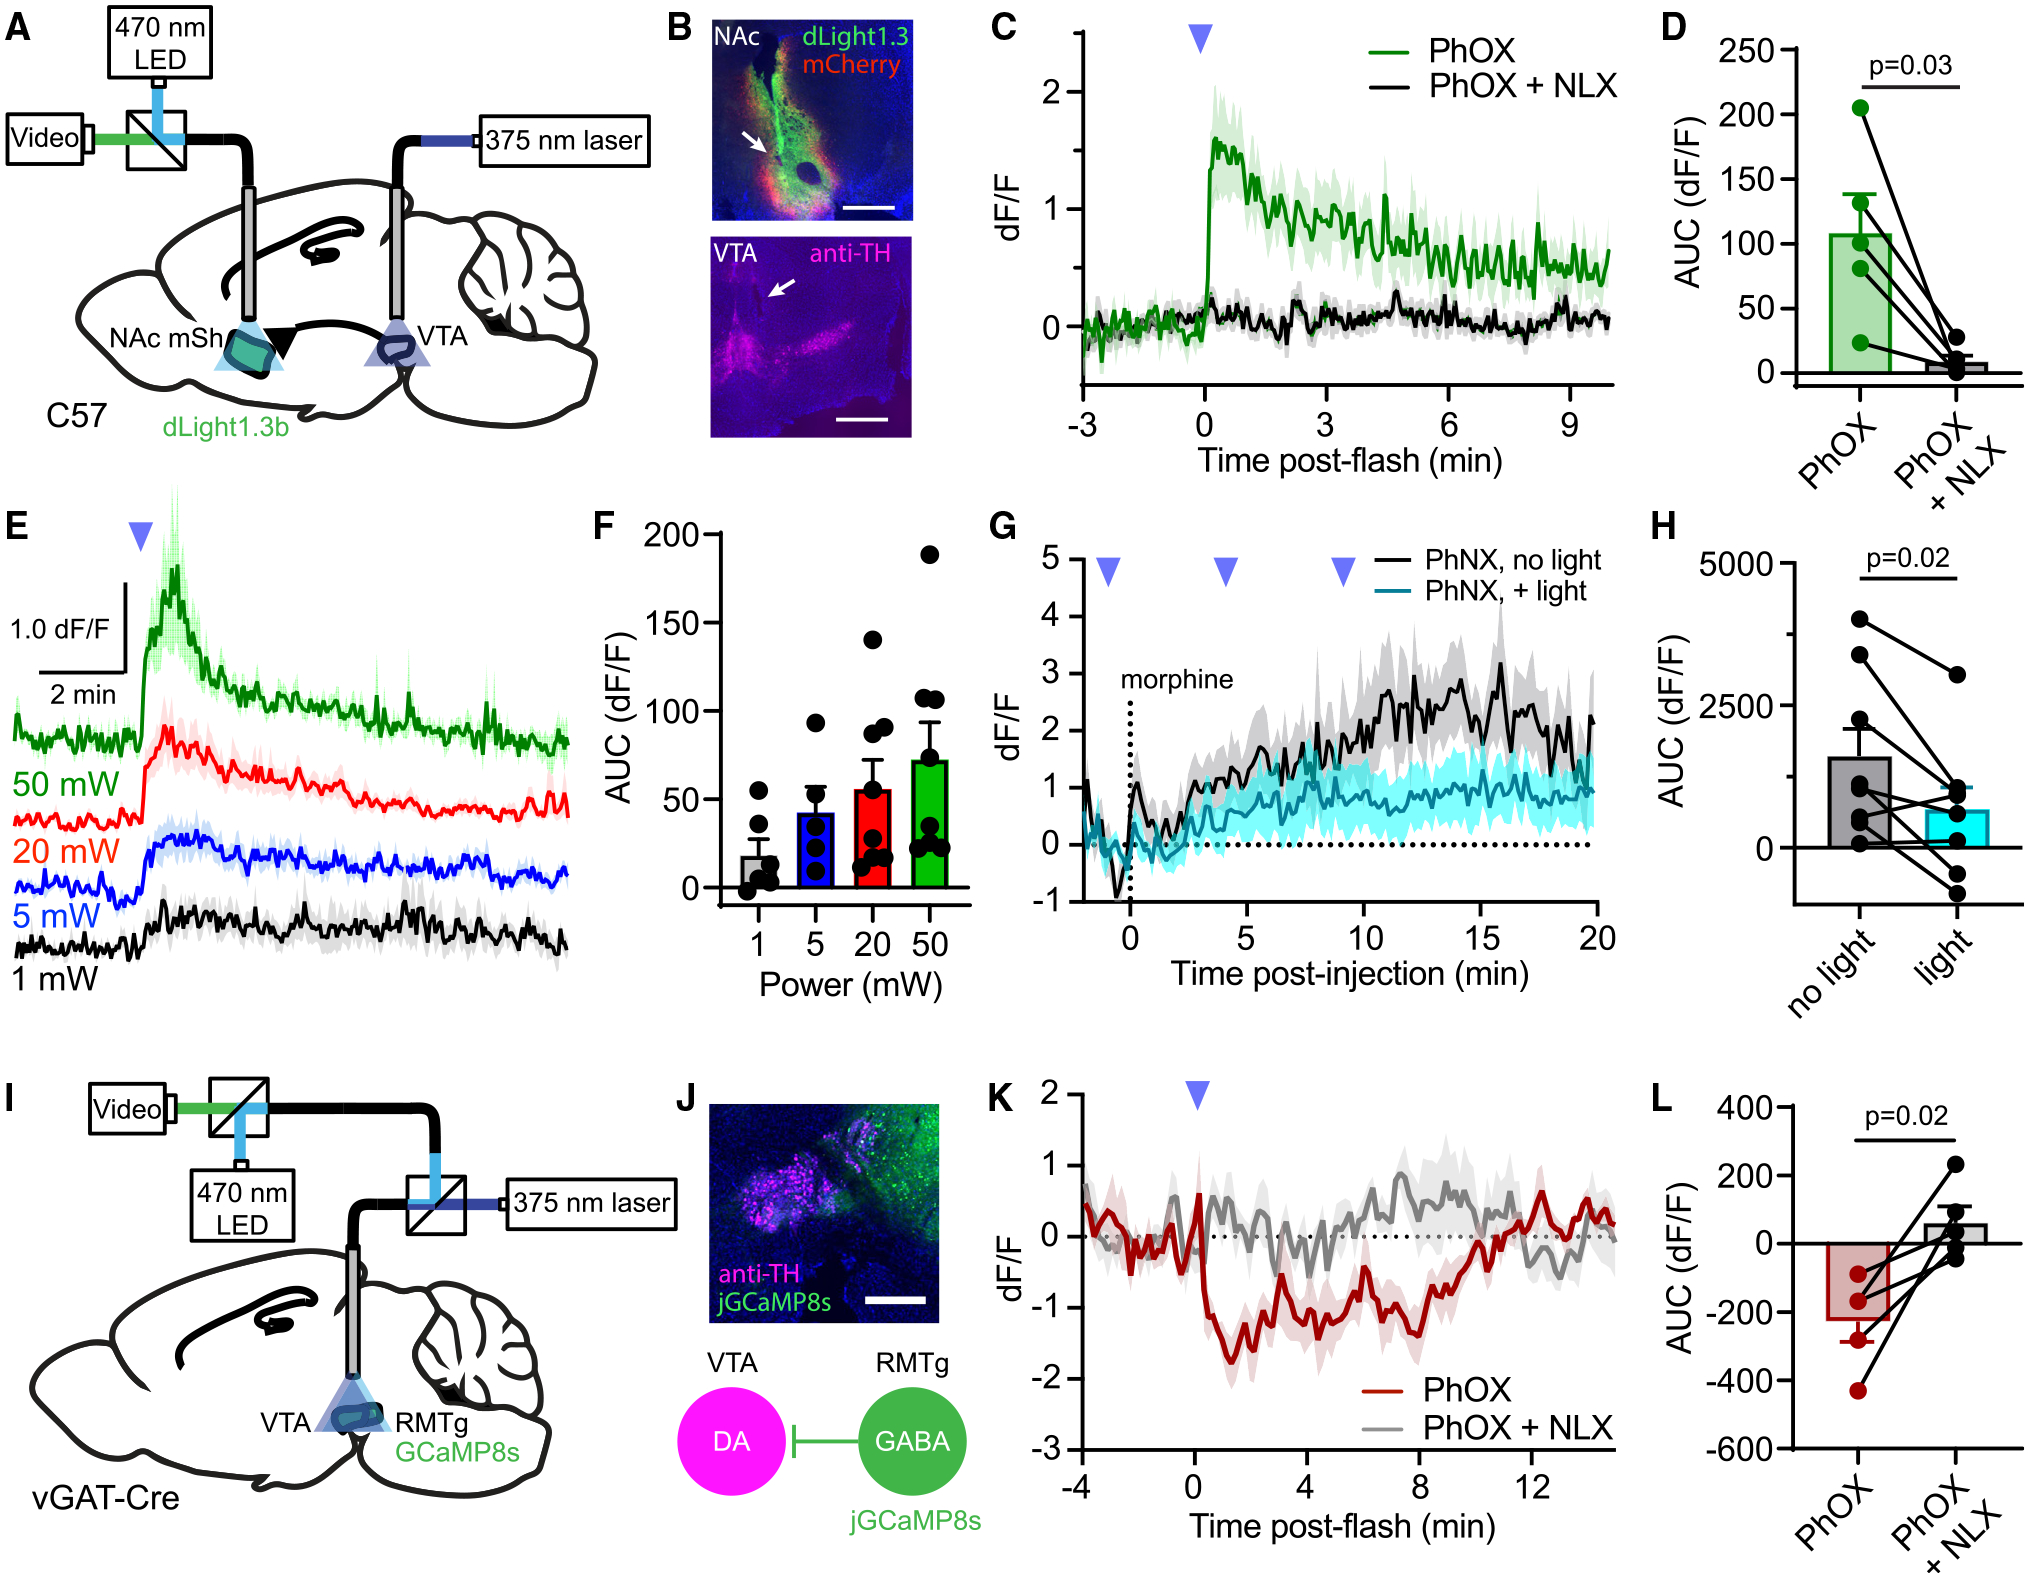
Figure 6. Interfacing in vivo photopharmacology with fiber photometry.

(A) Schematic indicating fiber implantation in the VTA for uncaging and fiber photometry recording of extracellular dopamine in the ipsilateral NAc-mSh.
(B) Example images of viral expression and fiber implantation site for fiber photometry in the NAc-mSh, and uncaging site in the VTA by immunostaining for tyrosine hydroxylase (TH, magenta). Scale bars, 0.5 mm (NAc) and 0.75 mm (VTA).
(C) Average NAc-mSh dLight1.3b fluorescence in response to VTA PhOX uncaging with a single light flash (n = 5 mice).
(D) Summary plot of the data shown in (C) (AUC [area under the curve], n = 5 mice, paired two-tailed t test).
(E) Average dLight1.3b fluorescence in response to a single light flash at the indicated light powers (n = 6–8 mice).
(F) Summary plot of the data shown in (E) (n = 6–8 mice).
(G) Average dLight1.3b fluorescence in the NAc-mSh in response to systemic morphine, with or without PhNX uncaging in the ipsilateral VTA (n = 8 mice).
(H) Summary plot of the morphine-evoked fluorescence changes shown in (G) (n = 8 mice, paired two-tailed t test).
(I) Schematic indicating implantation of a fiber over the VTA coupled to both a 375-nm laser and a fiber photometry recording system to detect changes in Ca2+ activity, with jGCaMP8s expressed in RMTg GABA neurons.
(J) (Top) Example image of the fiber implant site along with jGCaMP8s expression in RMTg GABA neurons. Scale bars, 0.5 mm. (Bottom) Diagram depicting inhibition of VTA dopamine (DA) neurons by jGCaMP8s-expressing RMTg GABA neurons.
(K) Average normalized jGCaMP8s fluorescence in response to PhOX uncaging with a single light flash (n = 5 mice).
(L) Summary plot of the data shown in (K) (n = 5 mice, paired two-tailed t test). All data are plotted as mean ±SEM. See also Figure S7.
