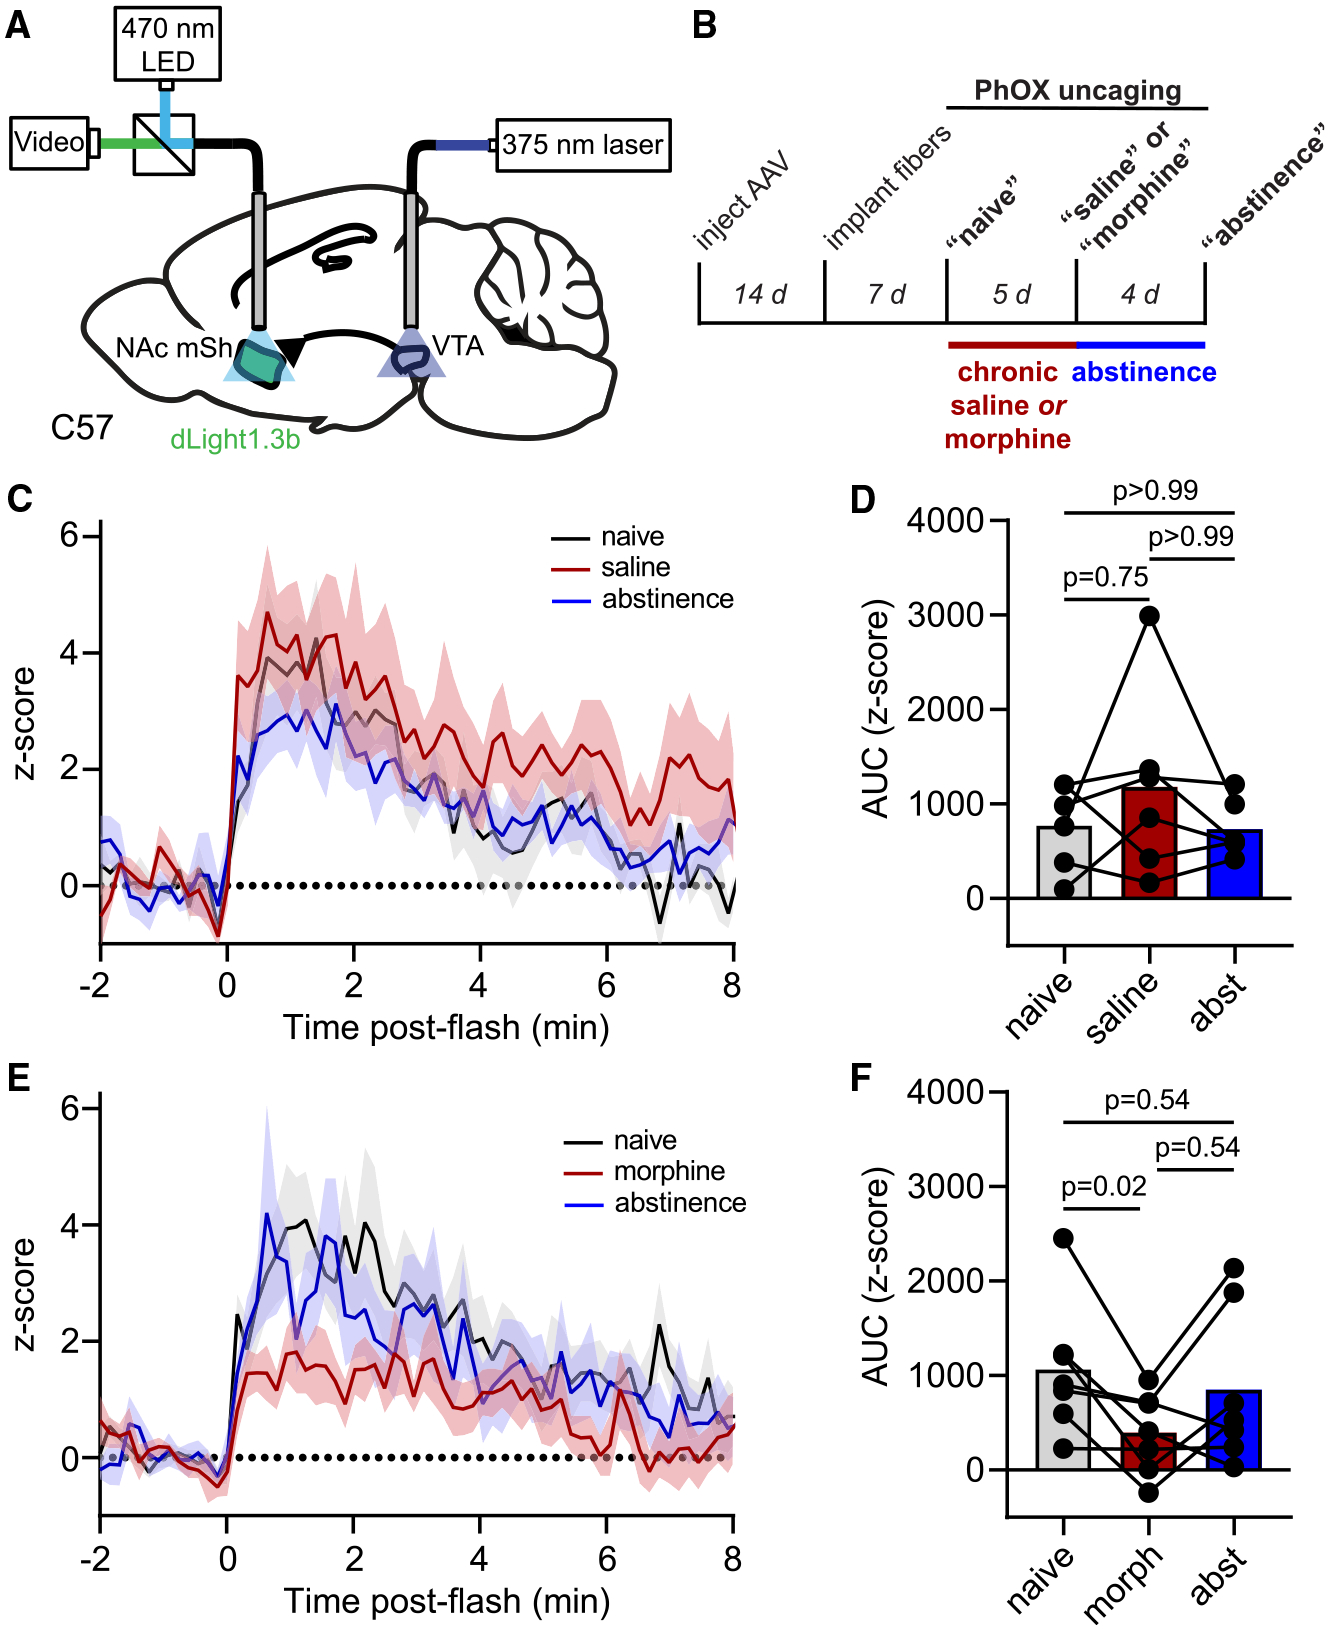
Figure 7. Combined in vivo uncaging and fiber photometry reveal drug-dependent changes in the opioid sensitivity of mesolimbic dopamine signaling.

(A) Schematic indicating fiber implantation in the VTA for uncaging and fiber photometry recording of extracellular dopamine in the ipsilateral NAc-mSh.
(B) Experimental timeline.
(C) Average Z scored dLight1.3b fluorescence in the NAc-mSh in response to PhOX uncaging before, during, and after chronic saline administration (n = 6 mice).
(D) Summary plot of the data shown in (C) (n = 6 mice, Friedman test, p = 0.57, Dunn’s multiple comparisons test).
(E) Same as (C) but for chronic morphine (n = 7 mice).
(F) Same as (D) but for chronic morphine (n = 7 mice, Friedman test, p = 0.027, Dunn’s multiple comparisons test). All data are plotted as mean ± SEM.
