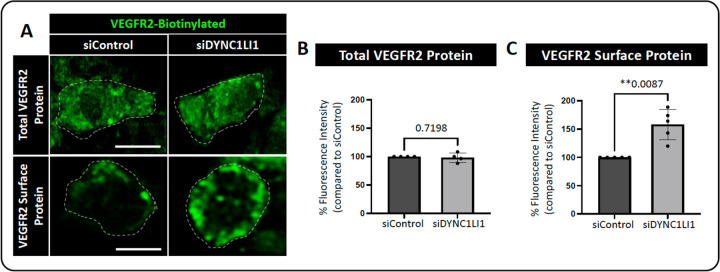
Figure 3: VEGFR2 protein surface localization is increased in LIC1-deficient HUVECs.
A. Representative single plane images of total VEGFR2 versus surface expression in HUVECs treated with siDYNC1LI1 versus siControl. Cells were simulated with 40 ng/ml VEGF-A for 1 hour then fixed and immunostained. Dashed lines highlight individual cell borders. B. Quantification of total (whole cell, permeabilized) VEGFR2 protein levels. C. Quantification of surface (non-permeabilized) VEGFR2 protein levels. For panels B and C, each dot represents data from an independent experiment. Statistics for panels B and C were calculated using an unpaired t-test with Welch’s correction. Data are presented as the mean ± S.D. Scale bars: 10um.

