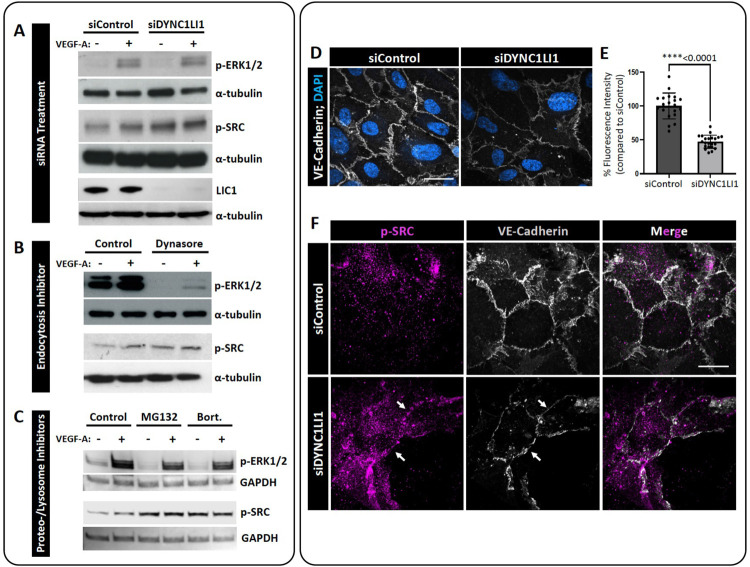
Figure 4: p-SRC activation is increased in LIC1-deficient HUVECs.
A-C. Representative Western blots of p-SRC and p-ERK1/2 activation in response to VEGF-A stimulation in siDYNC1LI1-transfected HUVECs compared to siControl cells (A); Dynasore-treated HUVECs compared to DMSO vehicle control treated cells (control, B); and HUVECs treated with MG132 or Bortezomib compared to DMSO vehicle control treated cells (control, C). GAPDH or a-tubulin are shown as protein loading controls. LIC1 levels following siRNA treatment is shown to confirm protein suppression (A). D. Immunofluorescent labeling of VE-Cadherin (grey) and nuclei (blue) in HUVECs transfected with siDYNC1LI1 or siControl. E. Quantification of VE-Cadherin levels. Statistics for panel E were calculated using an unpaired t-test with Welch’s correction. Data are presented as the mean ± S.D. F. Immunofluorescent labeling of VE-Cadherin (grey) and p-SRC (magenta) in HUVECs transfected with siDYNC1LI1 or siControl. White arrows highlight EC-EC boundaries. Scale bars: 5um.

