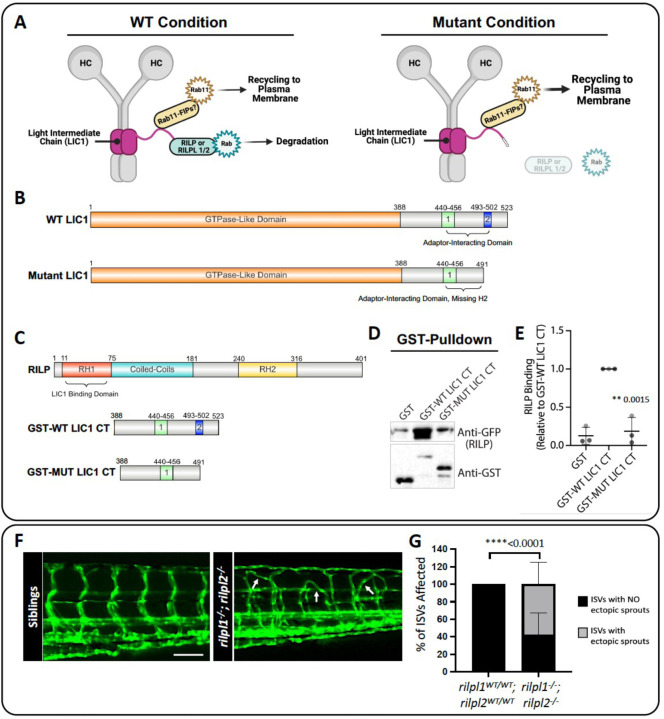
Figure 6: rilpl1/2 mutants recapitulate the increased angiogenesis phenotype seen in dync1li1y151/y151 mutants.
A. Schematic representation of the role of RILP or RILPL1/2 in bridging LIC1 and Rab binding. RILP is an adaptor for Rab7, and RILPL1/2 are adaptors for Rabs 8, 10, and 36, all of which regulate lysosomal biogenesis and degradation. Mutations to RILP or RILPL1/2 are predicted to impair Rab binding to endosomes and decreased lysosomal degradation. B. WT LIC1 domains: GTPase Like Domain (1–388) and Adaptor-Interacting Domain (Helix 1 (440–456) and Helix 2 (493–502)). Mutant LIC1 domains: GTPase Like Domain (1–388) and Adaptor-Interacting Domain (Helix 1 (440–456), Helix 2 is deleted in this mutant). The mutant LIC1 introduces a 19 bp insertion at the end of exon 12. This insertion adds 2 amino acids: aspartic acid (Asp), leucine (Leu), and a premature “STOP” codon resulting in the complete loss of exon 13 and the H2 domain. C. Schematics of the proteins used for GST-binding assays. RILP: RILP Homology 1 (RH1) (11–75), Coiled-Coils (75–181), and RILP Homology 1 (RH2) (240–316) domains. RILP’s RH1 domain binds to the LIC1 Adaptor-Interacting Domain. GST-WT LIC1 CT (GST-fused wild type human LIC1 c-terminal adaptor-interacting domain, a.a. 388–523). GST-MUT LIC1 CT (GST-fused mutant human LIC1 c-terminal adaptor-interacting domain a.a. 388–491, including the introduced Asp, Leu, STOP found in the zebrafish mutant, which is predicted to change protein conformation). Schematics created with Ibs.renlab.org. D. GST pulldown of WT human LIC1 C-terminus (GST-WT LIC1 CT) or the C-terminus bearing the equivalent mutation found in the dync1li1y151 mutant zebrafish (GST-MUT LIC1 CT). Purified RILP protein displays decreased binding to the mutant LIC1 C-terminus compared to WT LIC1 C-terminus. E. Quantification of the Western blot data assessing RILP binding to GST-WT LIC1 CT versus GST-Mut LIC1 CT. n=3. F. Confocal images of rilpl1/2 double-mutants at 96 hpf. G. Percentage of ISVs displaying ectopic sprouts in rilpl1/2 double-mutants compared to WT control siblings at 96 hpf. n=20 embryos. Statistics were calculated using an unpaired t-test with Welch’s correction. Data are presented as the mean ± S.D. Schematics created with BioRender.com. Scale bars: 50um.

