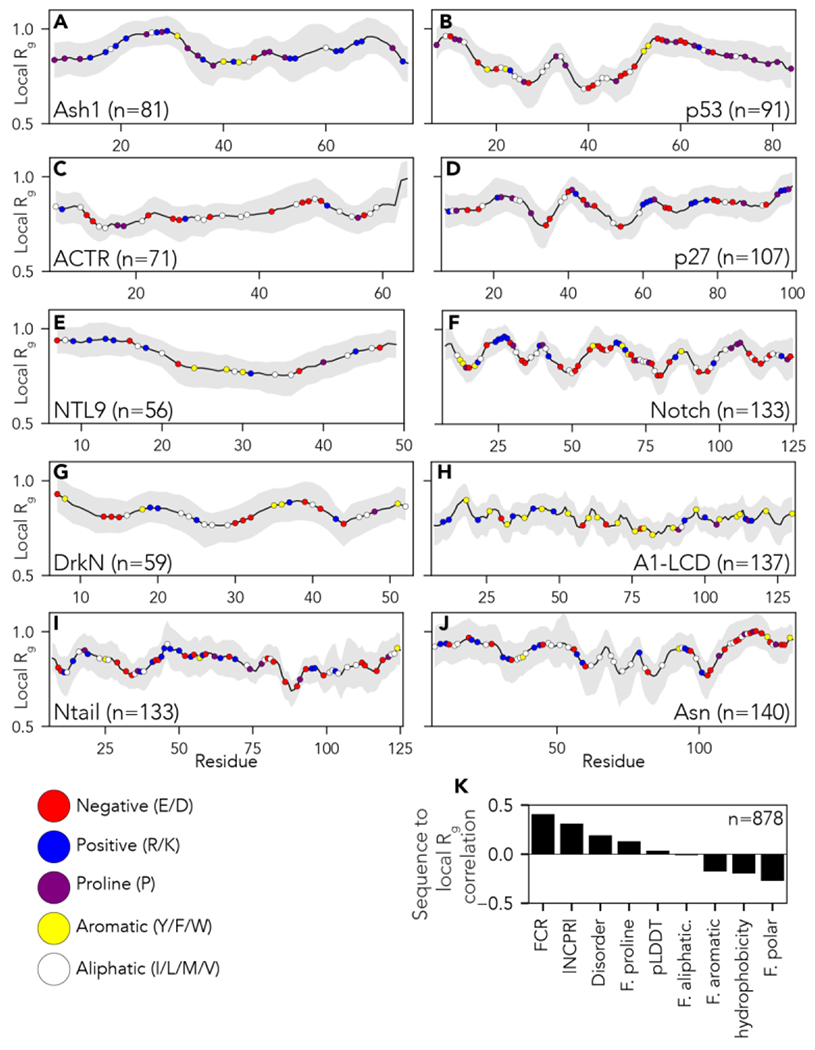
Figure 3:

Local chain compaction with residue chemistry superimposed over the local radius of gyration (Rg). (A-J) Individual plots showing analysis for each protein ensemble as introduced in Figure 2. Local Rg is calculated using a 14-residue sliding window. Colored circles on each plot represent different amino acid chemistry groups, highlighted in the legend below panel I. (K) Pearson’s correlation coefficient between local Rg obtained for each windowed fragment reported in panels A-J and the amino acid chemistry within the window in question (see also Fig. S2). Specific sequence properties reported are the Fraction of Charged residues (FCR), absolute net charge per residue (|NCPR|), mean disorder score as predicted by metapredict (Disorder), fraction of proline residues (F. proline), mean predicted Local Distance Difference Test (pLDDT - a measure of predicted AlphaFold2 structure confidence), fraction of aliphatic residues (F. aliphatic), fraction of aromatic residues (F. aromatic), Kyte Doolitle hydrophobicity (hydrophobicity) and fraction of polar residues (F. polar). The fraction of charged residues (FCR) is the strongest positive determinant of expansion, closely followed by the absolute net charge per residue (|NCPR|). While polar residues, in principle, correlate as negative determinants of expansion, the negative correlation is driven by subregions deficient in charged residues and enriched in only polar residues.
