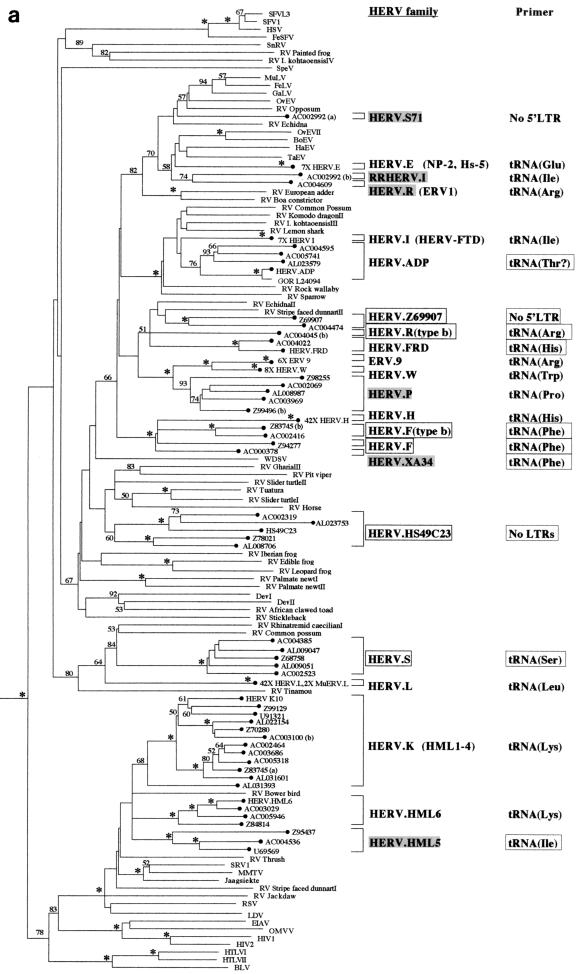
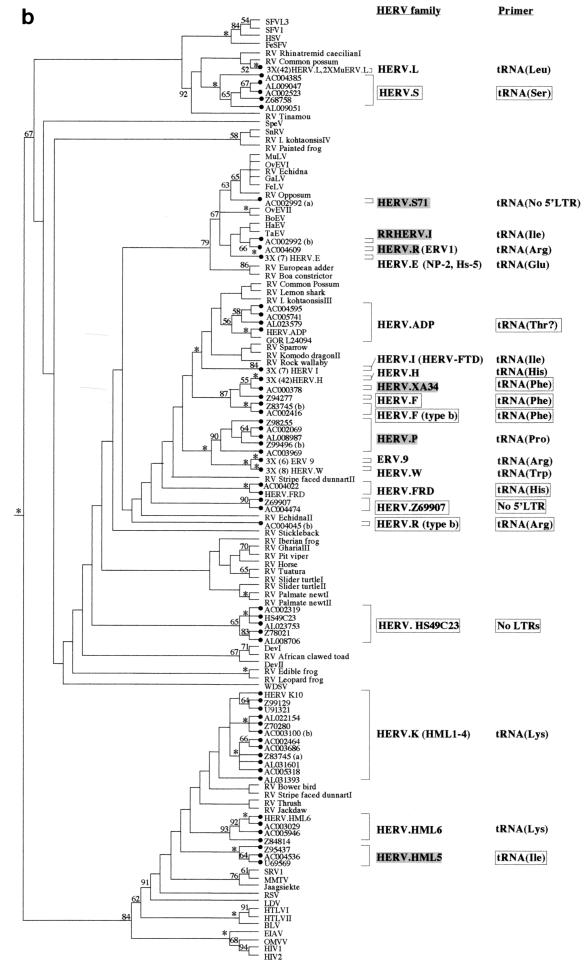
FIG. 1.
Phylogenetic analyses of a 159-residue region of retroviral RT proteins. The trees were rooted on several gypsy LTR-retrotransposon sequences. To save space, multiple taxon names in some well-supported terminal clusters are not indicated. Instead, the number of taxa that actually clustered in that position are indicated on the taxon label. (a) Neighbor-joining tree with branch lengths proportional to the degree of divergence between the sequences. Figures on each branch represent percentage bootstrap support from 1,000 replicates; asterisks show support of at least 95%. HERVs are indicated by black circles. Novel HERV families are boxed. Previously described HERV families are shaded gray if the sequence of the pol gene was not available, and they were classified according to their closest cosmid matches (see Table 1). Elements in parentheses are likely to cluster with the adjacent family. Primer sites indicate the tRNA to which the viral PBS is most similar; these are boxed when this similarity is first reported in this study. (b) Strict consensus of 1,200 maximum-parsimony trees. The figure is labeled as in panel a except that branch lengths are not proportional to the divergence between the taxa. Also note that in contrast to panel a, maximum-parsimony data sets were pruned prior to analysis to reduce computation times. Thus, the first figure presented on some of the taxon labels represents the actual number of elements included in the analysis, whereas the number in parentheses represents the total estimated number that would cluster with the particular family if the additional elements had also been included in the data set (based on at least 95% bootstrap support by the neighbor-joining method; see Materials and Methods).


