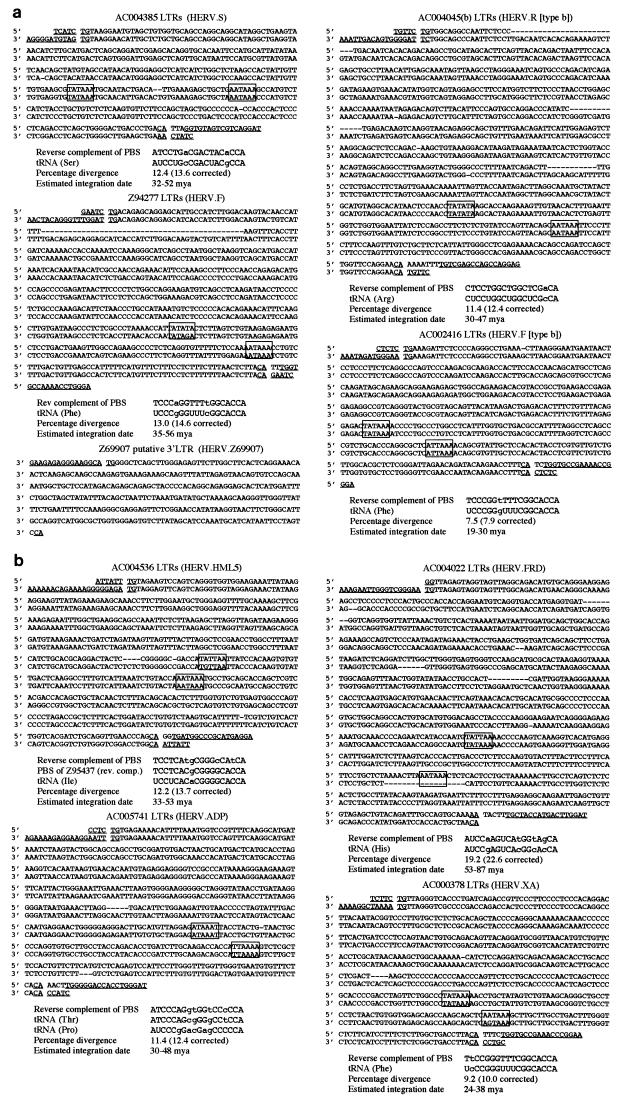
FIG. 3.
LTR sequences of five novel HERV families (a) and four partially characterized families (b). When both the 5′ and 3′ LTRs could be identified, they were aligned against each other, with dashes representing missing residues. The PPT (before the start of the 3′ LTR) and PBSs (after the end of the 5′ LTR) are underlined, as are the direct repeats flanking each end of the element and the inverted repeats flanking each LTR. The promoter and polyadenylation signals are boxed. In some cases, not all these features could be identified for each element (or they differ slightly from the expected sequence). This is probably due to postintegration mutation. Similarly, this is also likely to account for the observed differences between the PBS and closest-match tRNA sequence shown below each alignment. The estimated integration dates of each HERV are also shown.

