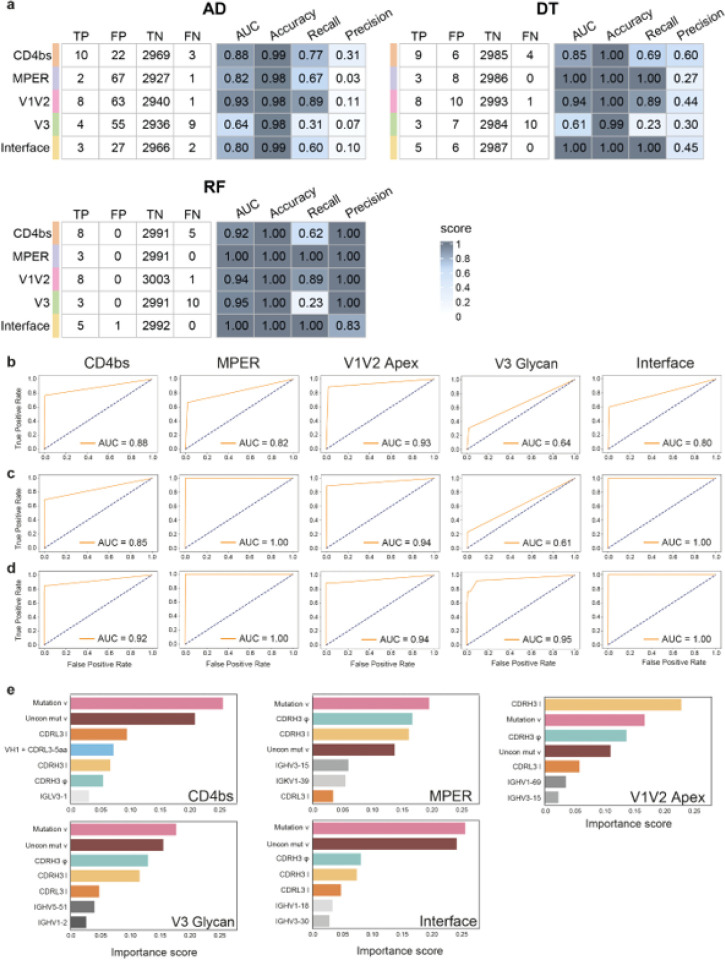
Figure 3. Performance of RAIN machine learning models.
(a)-Performance metrics of the three algorithms using the test dataset with Accuracy = (TP+TN) / (TP+FP+TN+FN), Recall = TP / (TP+FN) and Precision = TP / (TP+FP). (b-d)-Receiver-operating characteristic (ROC) curves and corresponding area under the curve (AUC) statistics for each bNAb antigenic site with test dataset. Each row represents one algorithm, (b)-AD, (c)-DT, and (d)-RF, (e)-Most important features with their scores for each bNAb classified by binding antigenic site using the Random Forest classifier.

