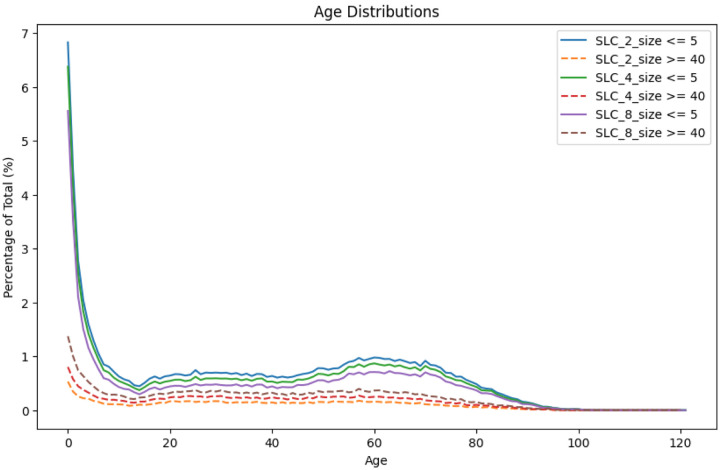
Figure 15.
Age (unadjusted) distributions for small and large cluster ranges using SNP thresholds of 2, 4, and 8 SNPs
Comparison of the percent of cases in different age groups within small and large cluster sizes and using SNP thresholds of 2, 4, and 8 SNPs to form the single linkage clusters. These are actual case counts by age and are not normalized for the demographics.

