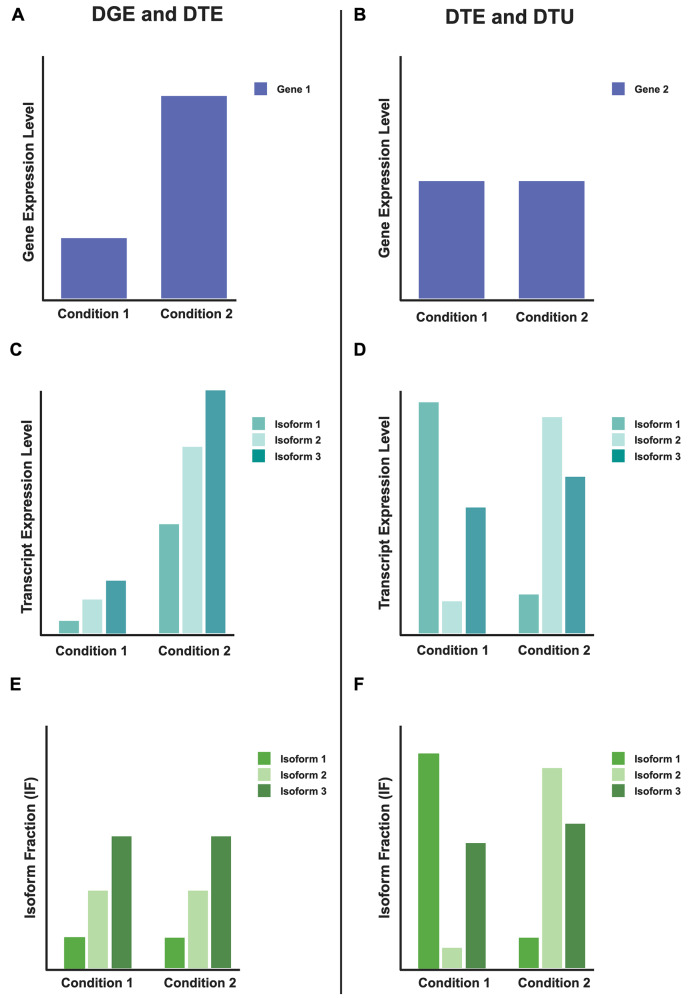
Fig. 1.
Two examples of DGE, DTE, and DTU for two genes. These cartoon examples portray two genes with three transcript isoforms in two conditions. Both genes have significant DTE, but Gene 1 has no significant DTU (A, C, and E), while Gene 2 has significant DTU (B, D, and F). (A and B) Cartoon examples representing the overall gene expression: (A) shows down-regulation of Gene 1 in condition one compared to condition two, and (B) shows about equal expression of Gene 2 across both conditions. (C and D) Cartoon examples representing transcript isoform expression between the two conditions. (E and F) Cartoon examples showing isoform fraction (IF) in these two genes, where (E) shows no change in IF across the two conditions and, therefore, no significant DTU. (F) Cartoon showing significant changes in IF across conditions, revealing significant DTU. IF is calculated by the number of counts for a specific isoform divided by the total number of read counts for that gene (including all isoforms)

