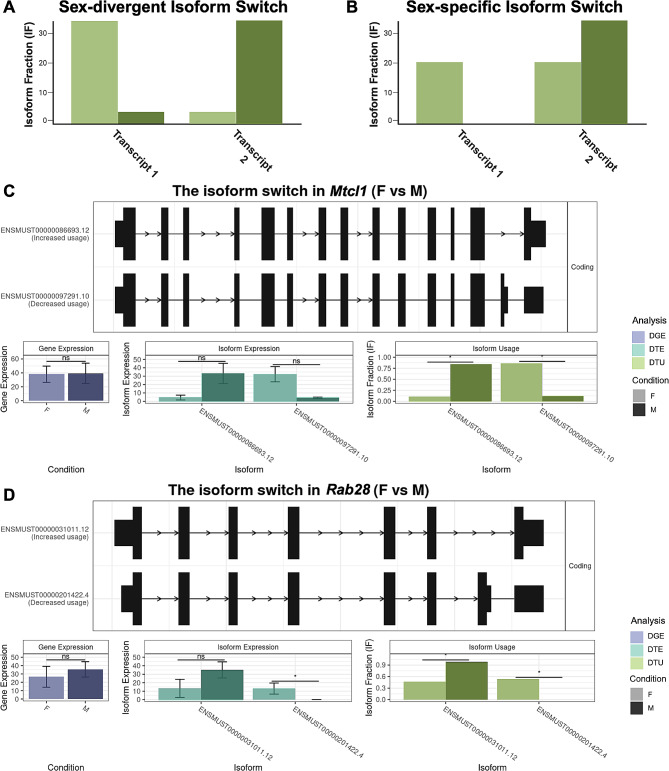
Fig. 5.
Sex-divergent and sex-specific DTU. (A-B) Representative cartoons exemplify two transcript expression patterns of isoform switching: sex-divergent (A) and sex-specific (B). (C) Switchplot displaying a transcript summary, DGE (Wald test with BH correction p < 0.05, purple), DTE (Wald test with BH correction p < 0.05, cyan), and DTU (analysis of deviance chi-squared test with BH correction p < 0.05, green) of the sex-divergent gene Mtcl1 in the cortex between females (F; light color) and males (M; dark color). (D) Switchplot displaying a transcript summary, DGE (Wald test with BH correction p < 0.05, purple), DTE (Wald test with BH correction p < 0.05, cyan), and DTU (analysis of deviance chi-squared test with BH correction p < 0.05, green) of the sex-specific gene Rab28 in the striatum between females (F; light color) and males (M; dark color). Please note that these plots do not display all possible transcript structures of this gene, only the ones measured in our dataset. In the indicated comparison, ns denotes not significant and * denotes P < 0.05

