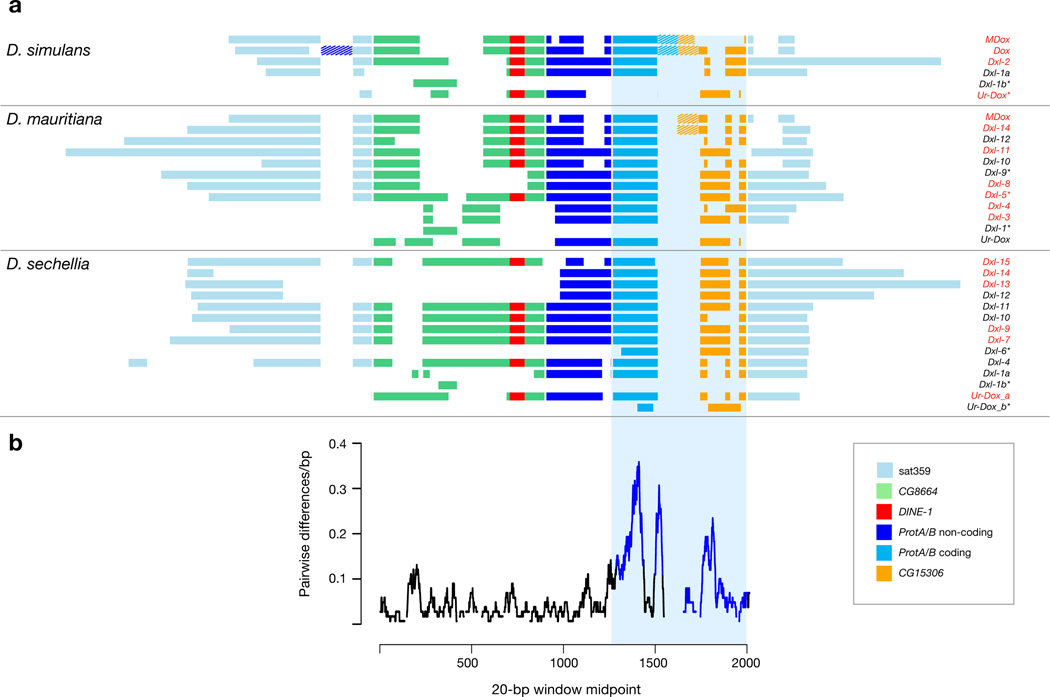
Figure 4.
Structural and sequence evolution among Dxl gene copies. a. Schematic alignment of all known Dxl copies, organized by species, and color-coded by putative sequence homology. Internally duplicated segments are indicated by dashed fill. Dxl gene copies with RNA-seq evidence for expression are indicated by red font and those lacking an intact ORF are indicated by *. b. The average number of pairwise differences per bp among all Dxl copies is shown calculated in 20-bp windows across the region of Dxl homology. The blue box shows the alignment of sequences represented in panels a and b.

