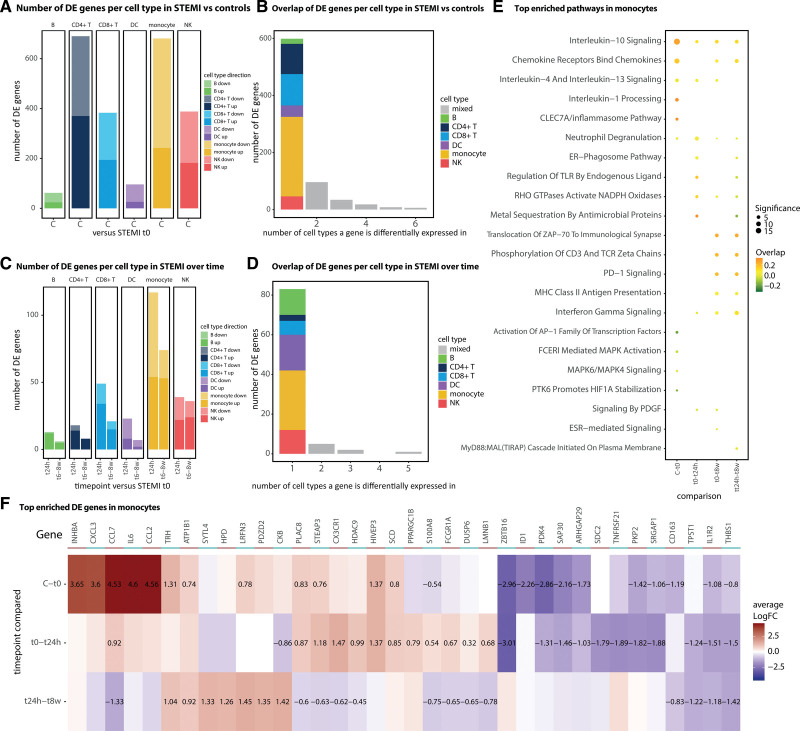
Figure 3.
Enriched differential expression (DE) genes and pathways. A, The number of up- and downregulated DE genes/cell type at ST-segment–elevated myocardial infarction (STEMI) t0 (n=37) vs controls (n=38) or (C) in patients with STEMI over time (n=37 t24h, n=38 t8w). B, Overlap of DE genes in cell types at t0 vs controls or (D) in patients with STEMI over time (taking all DE genes significant in at least one of the comparisons [t0–t24h or t0–t8w]). E, Top enriched inflammatory pathways in monocytes between conditions. F, Heatmap showing the LFC of the maximum 10 most significant up and down DE genes in monocytes that are involved in the immune system pathway. Genes are hierarchically clustered and the LFC is only provided for significant differences. C indicates control; DC, dendritic cells; logFC, log fold change; and NK, natural killer cells.

