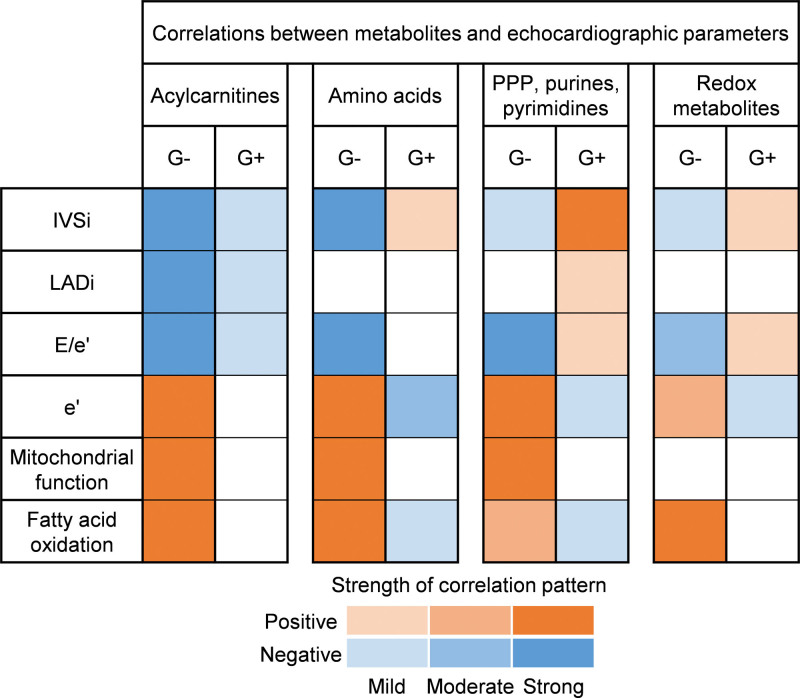
Figure 6.
Contrasting metabolic alterations underlie cardiac remodeling in genotype-negative (G−) and genotype-positive (G+) patients with hypertrophic cardiomyopathy (HCM). Matrix summarizing correlation patterns between metabolite classes and (functional) cardiac parameters in G− and G+ patients with HCM. Negative and positive correlation patterns are colored blue and orange, respectively. The color intensity reflects the strength of correlation patterns. IVSi indicates interventricular septum thickness indexed to body surface area; LADi, left atrial diameter indexed to body surface area; and PPP, pentose phosphate pathway;

