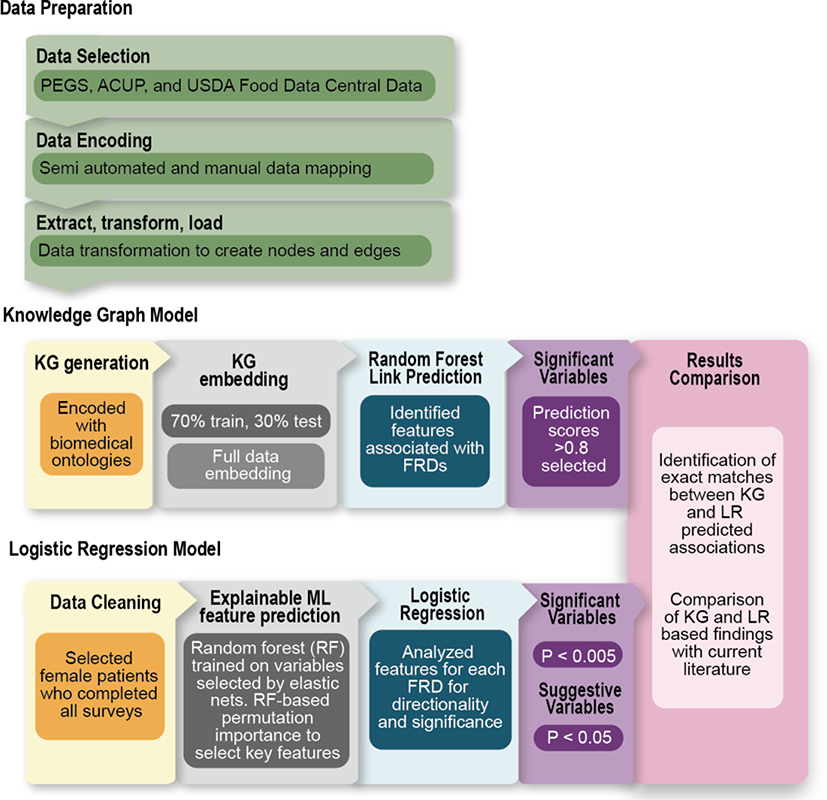
Fig. 3. Computational methods overview.
Starting with data preparation, our pipeline of data selection and encoding using biomedical ontologies harmonized our data for the transformations necessary to develop nodes and edges to construct our knowledge graph and logistic regression models. Two comparative analytical approaches were used to evaluate the Personal Environment and Genes Study (PEGS) survey data regarding internal and external exposures and personal health along with the Agricultural and Chemical Use Program (ACUP) and USDA Food Data Central data. The KG model included encoding all survey data with biomedical ontology content and creation of a KG structure, followed by embedding of the KG to create a low dimensional format for use in the random forest model to assess predicted links between FRDs of interest and exposures or health variables. The comparison logistic regression analysis system supported data interpretation by including 1) data cleaning, 2) application of elastic nets to initially select the most discriminative variables and improve regularization, 3) an explainable random-forest analysis that uses permutation-based feature importance to select important associations between exposures, health conditions, and FRDs, and 4) logistic regression to evaluate significance and directionality (interpretability) of the extracted associations.

