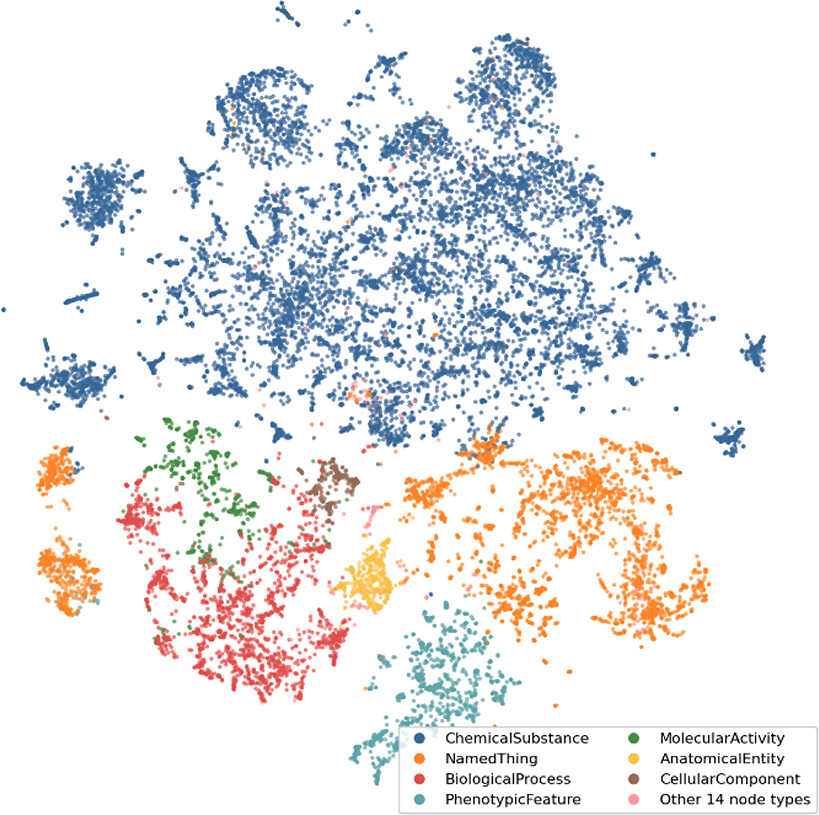
Fig. 4. KG visualization.
t-SNE visualization of the embeddings computed for the largest connected component in the KG. The node embeddings have been computed by using the DeepWalk algorithm followed by a Skipgram model, as implemented in the GRAPE library. The plot displays the variety of node types represented in the graph, where each node is represented by a dot and nodes with the same type are characterized by the same color. This visual serves as a preliminary assessment tool for the KG, showcasing how well the graph can decipher and cluster (conceptually and semantically) similar node types.

